In the financial markets Identifying and analyzing trends in stock prices are key functions of trading, where prices constantly fluctuate every second, traders and investors rely on various tools to predict future market movements.
Support and resistance are two essential concepts that help traders gain extra insight into the strength of a price trend and it is a fundamental concepts in technical analysis that help identify potential areas where price trends might pause, reverse, or break out.
Support and resistance are a part of technical analysis which help in identifying potential buying or selling opportunities. For example, if a stock’s or Index price falls to a support level, it may be viewed as a buying opportunity, as traders believe that the stock is unlikely to fall further. Conversely, if a stock’s or Index price rises to a resistance level, it may be viewed as a selling opportunity, as traders believe that the stock is unlikely to rise further.
“Support and resistance” is one of the most widely used concepts in trading to identify opportunities.
This article will help you understand the meaning and concept of support and resistance and give you all the information you need to effectively use the concept and enjoy a more rewarding trading experience.
In this article we will learn
- How to Find Support and Resistance Levels
- How to Trade with the help of these Levels
- To take maximum advantage of Breakout & Breakdown
- Type of Support & Resistance in all time frames
- How to make chart setups to trade confidently
What is Support and Resistance?
Support and resistance levels are the most extremely important concepts in technical trading. A large number of market participants continuously follow and monitor major support and resistance levels to identify trade setups and price levels that could potentially invalidate that setup, i.e. stop-loss levels. In this post, we’ll take a close look at what support and resistance levels are, how they form and how to trade them perfectly.
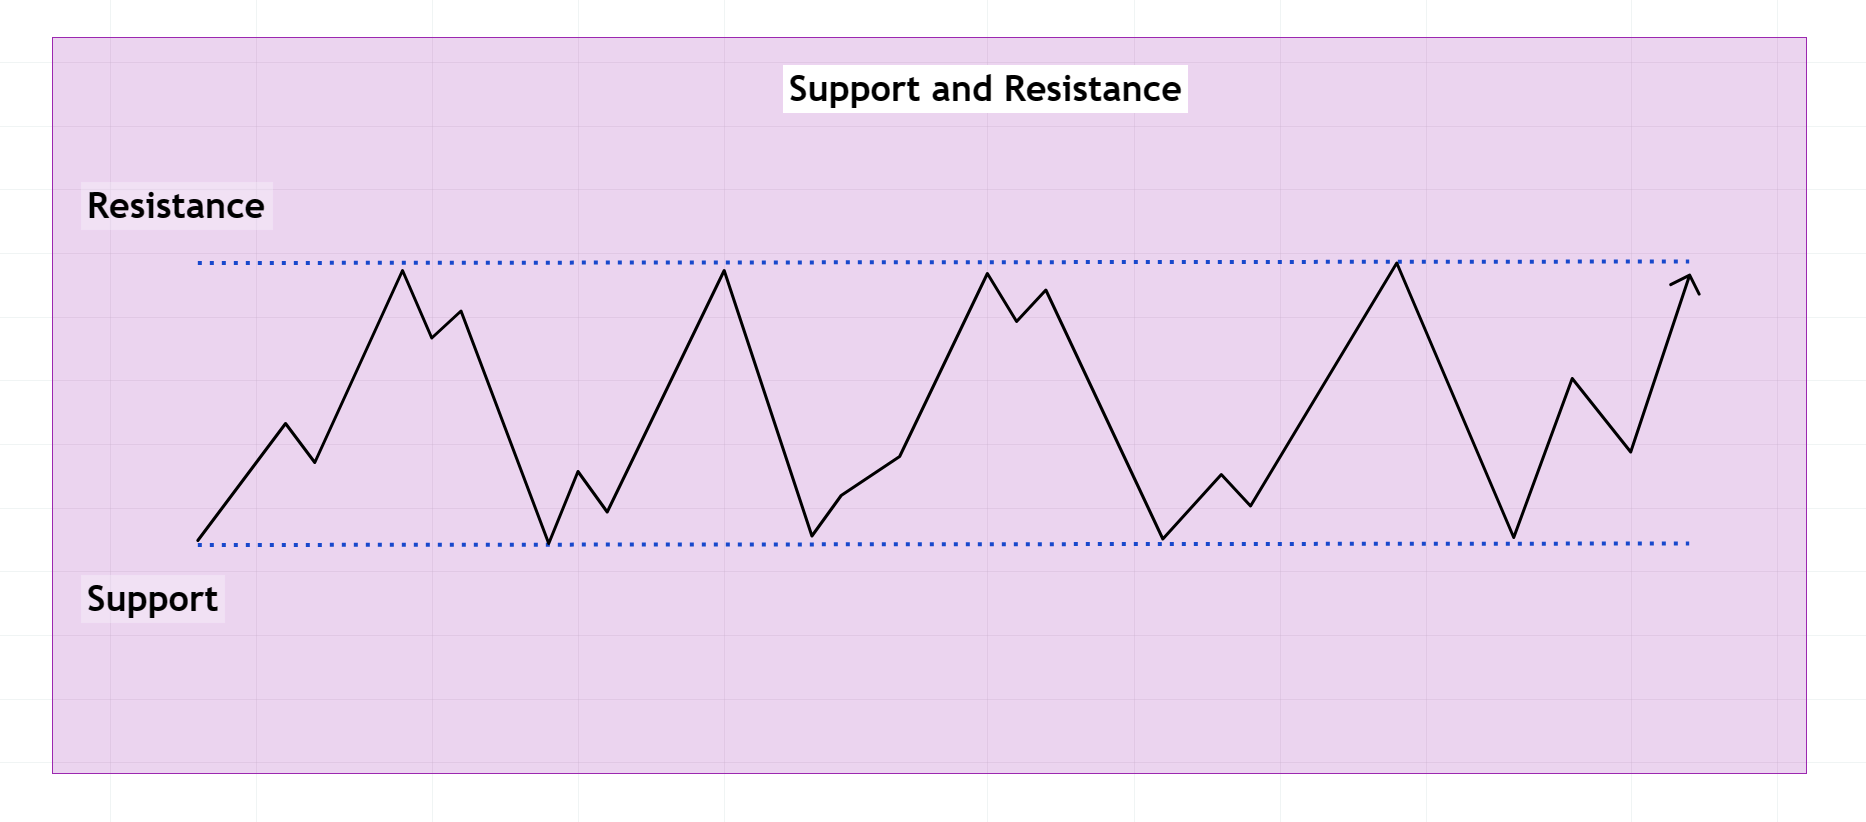
Finacial Market Example
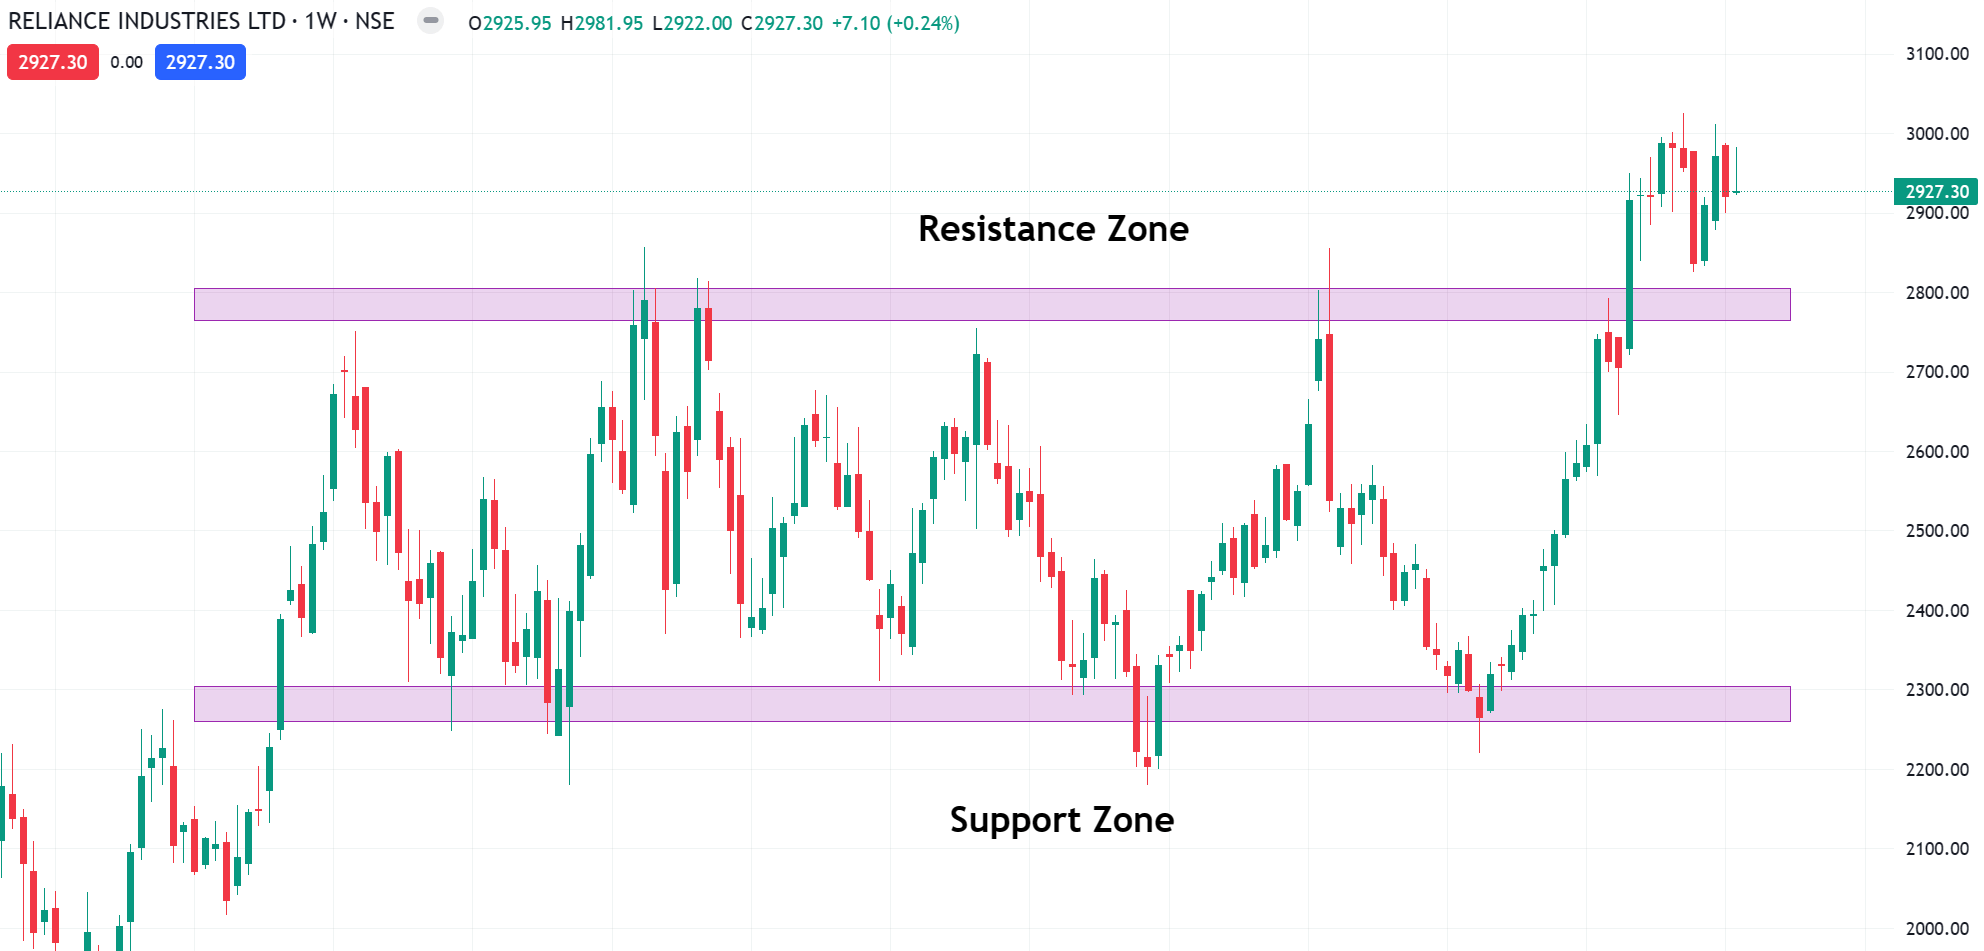
Let’s take a look at the basics first so clear all your doubts.
Support Level
Support is the price level at which demand is thought to be strong enough to prevent the price from declining further.
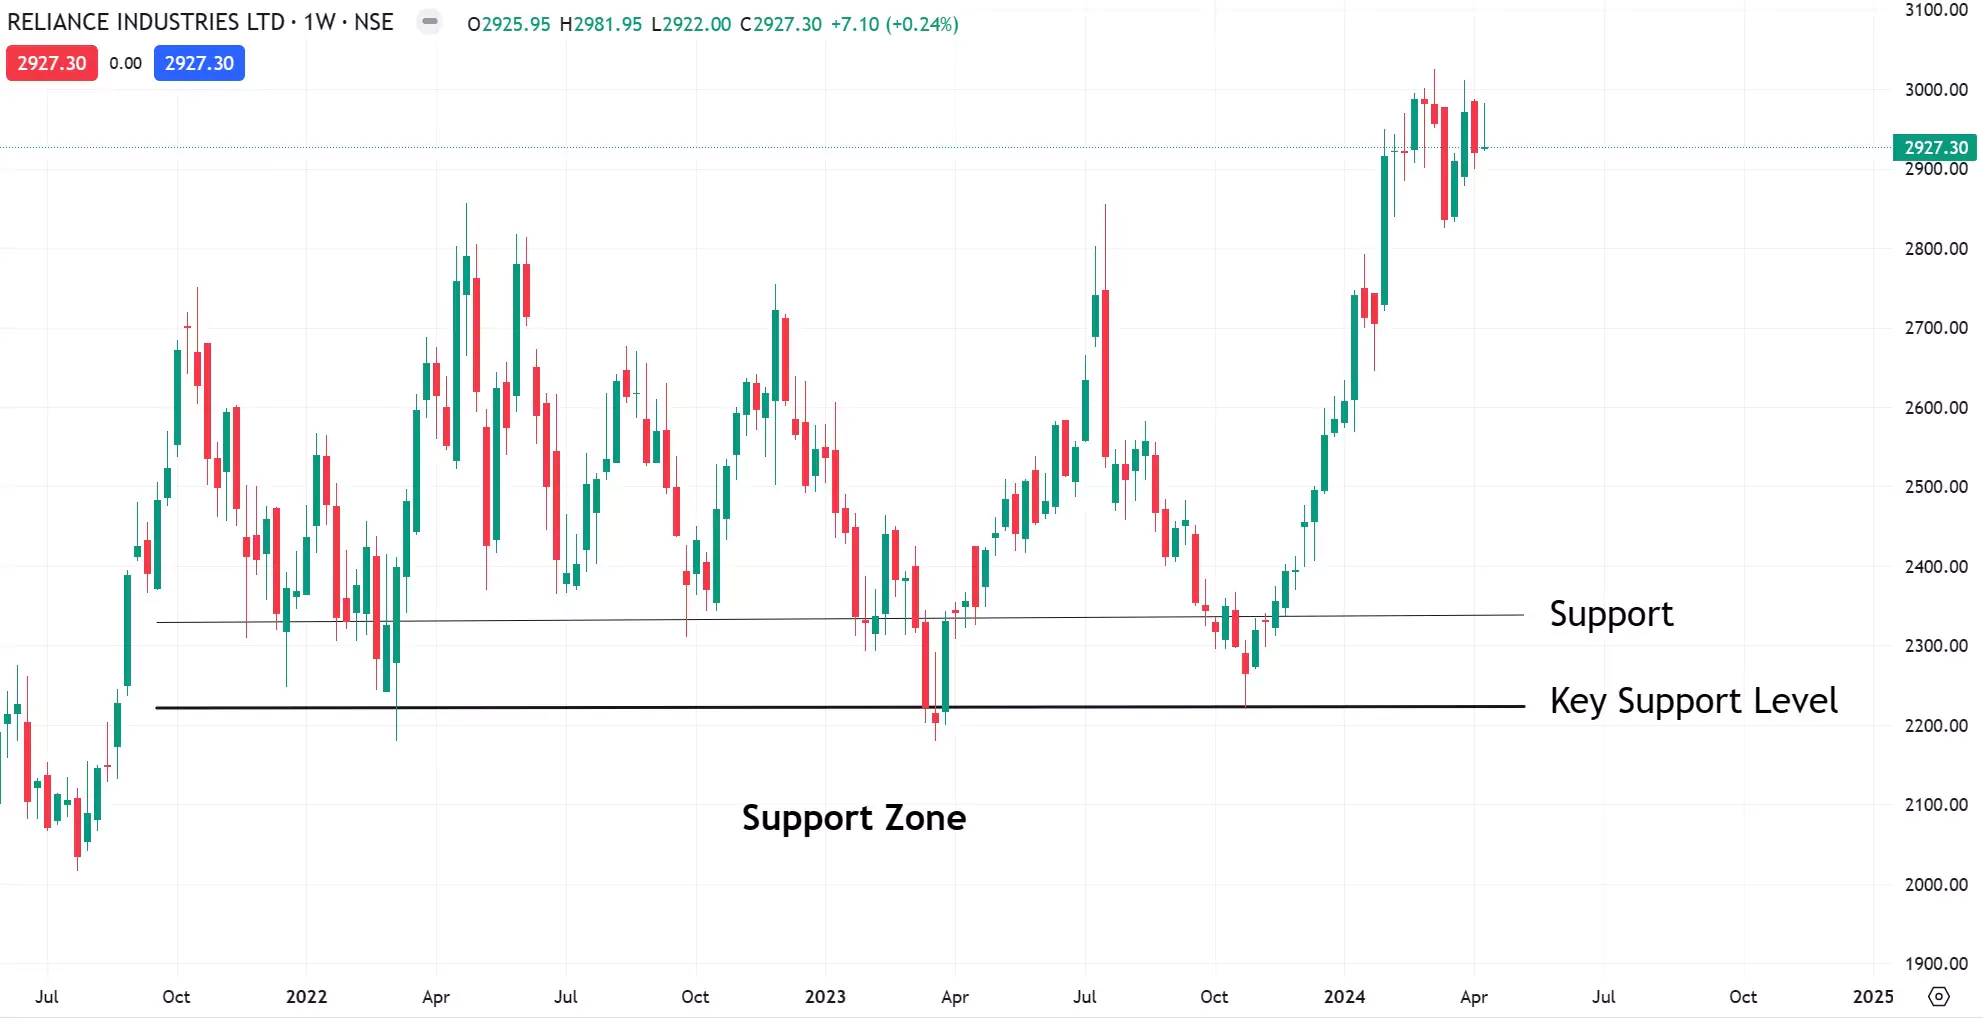
Understanding the support level should be quite simple. As the name suggests, support is something that prevents the price from falling further. The support level is a price point on the chart where the trader expects maximum buying demand coming into the stocks or index. Whenever the price falls to the support line, it is likely to bounce back. In simple support level is always below the current market price.
Resistance Level
Resistance is the price level at which selling is thought to be strong enough to prevent the price from rising further.
Resistance levels are similar to support levels, which stocks or index prices had difficulties to break above in previous attempts i.e. supply zone.
The following chart shows a simple horizontal resistance level.
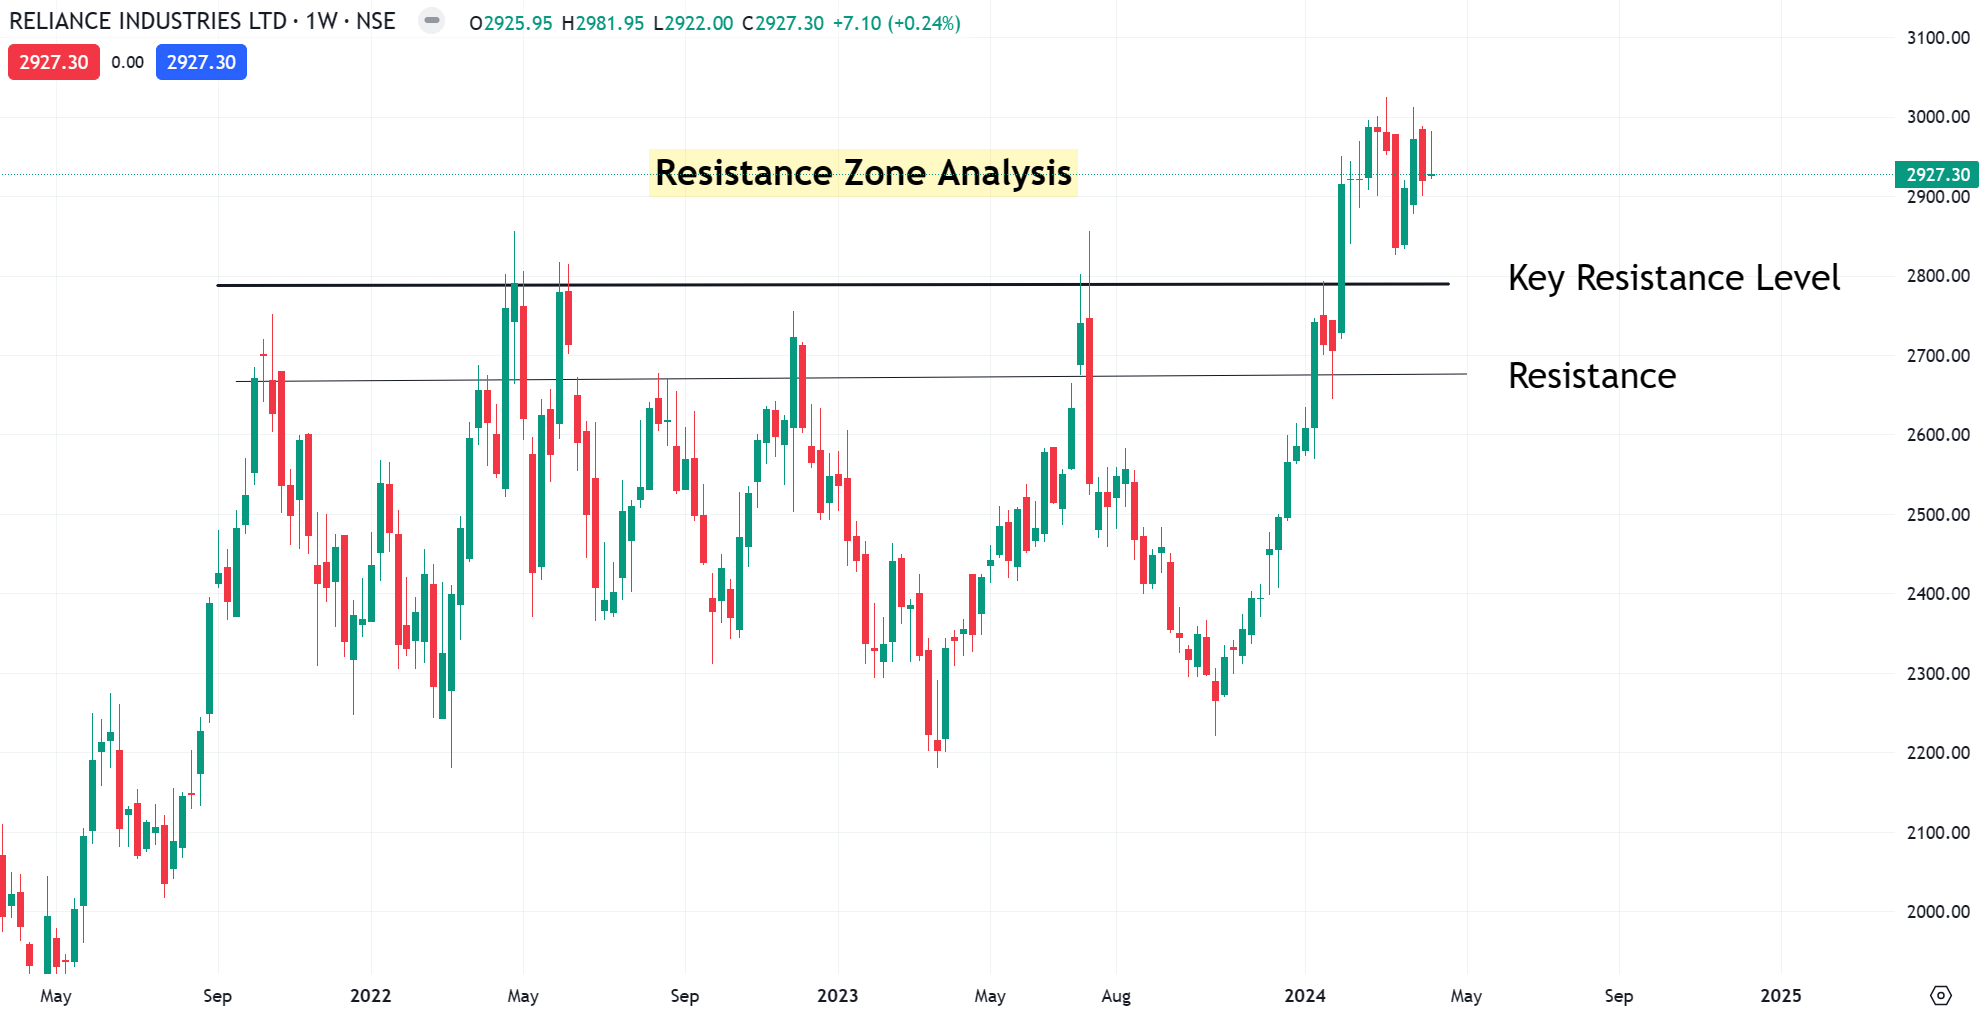
Explain Support and Resistance Concept
Let’s take a look at the Advance level so clear all your doubts.
You’ve probably read trading books that mostly say… the more Support or Resistance is tested, the stronger it becomes.
But the actual truth is…
The more times Support or Resistance is tested, the weaker it becomes and they try to get breakout.
Here’s why I say…
The market reverses from its support level because there is buying pressure to push the price higher. The buying pressure could be from Institutions, banks, or smart money that trades in large quantity.
Now Imagine this:
If the market keeps re-testing this Support multiple time, these orders will eventually be filled. And when all the orders are filled, who’s left to buy?
Thats it what I mean….
also always remember Support and Resistance are areas on your chart not lines.
Important Note: The more times Support or Resistance is tested, the weaker it becomes
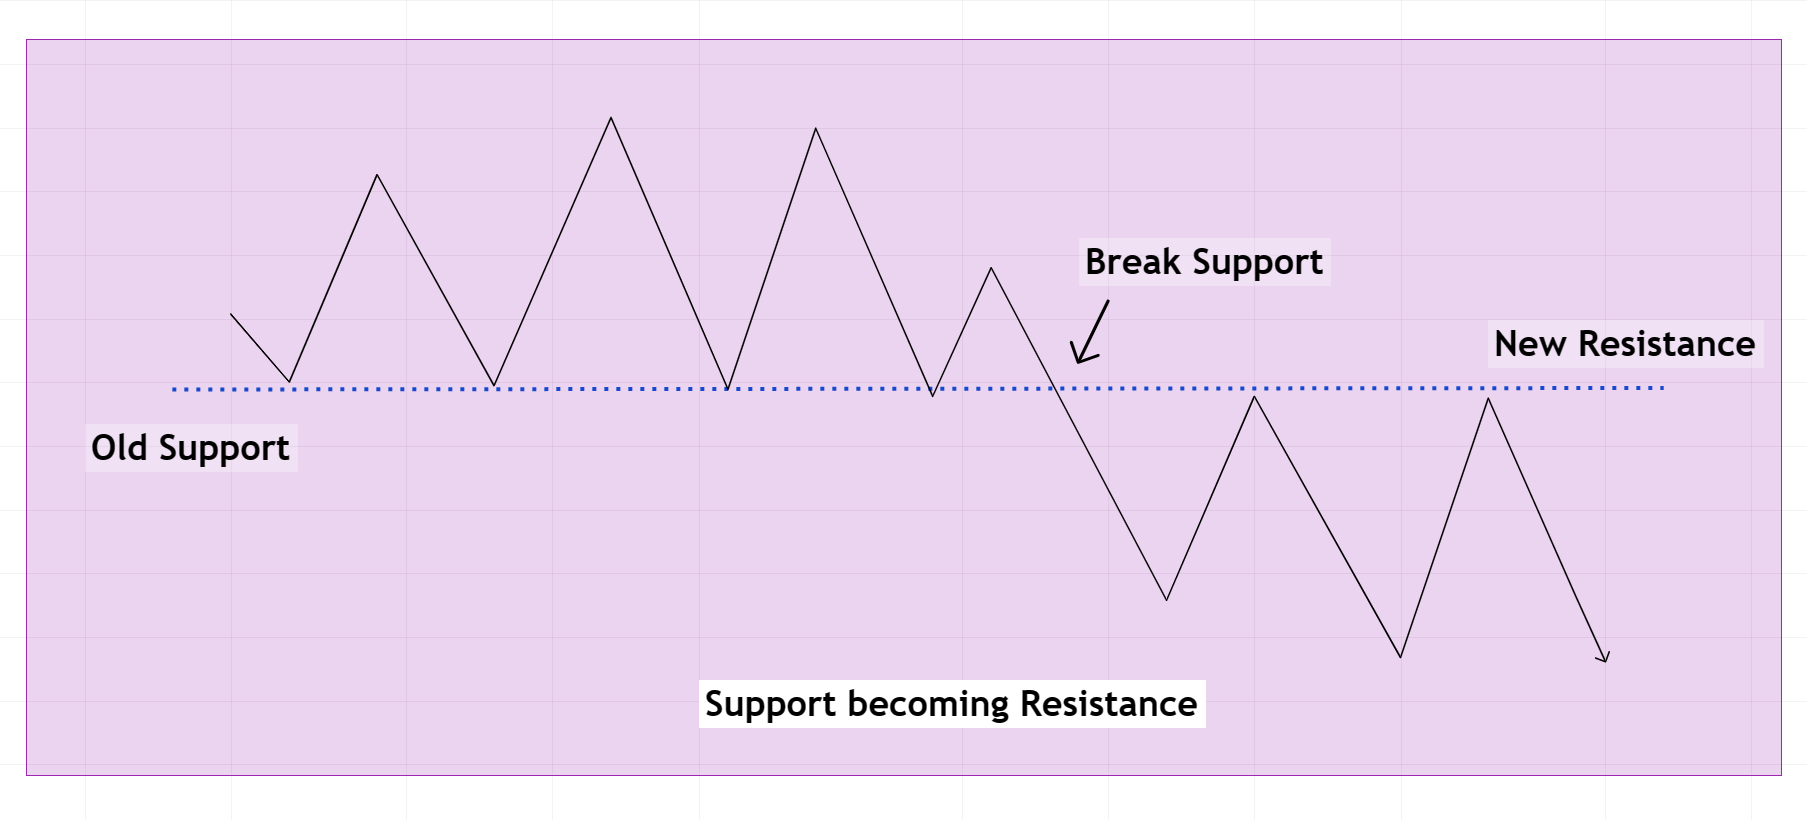
One of the most interesting facts about support and resistance is that when the price is finally able to break the support or resistance, then it forms a new support or resistance level.
The previous resistance becomes the new support level whereas the previous support level becomes the new resistance level. Refer following example to clear call your doubts.
Support becoming Resistance
Resistance becoming Support
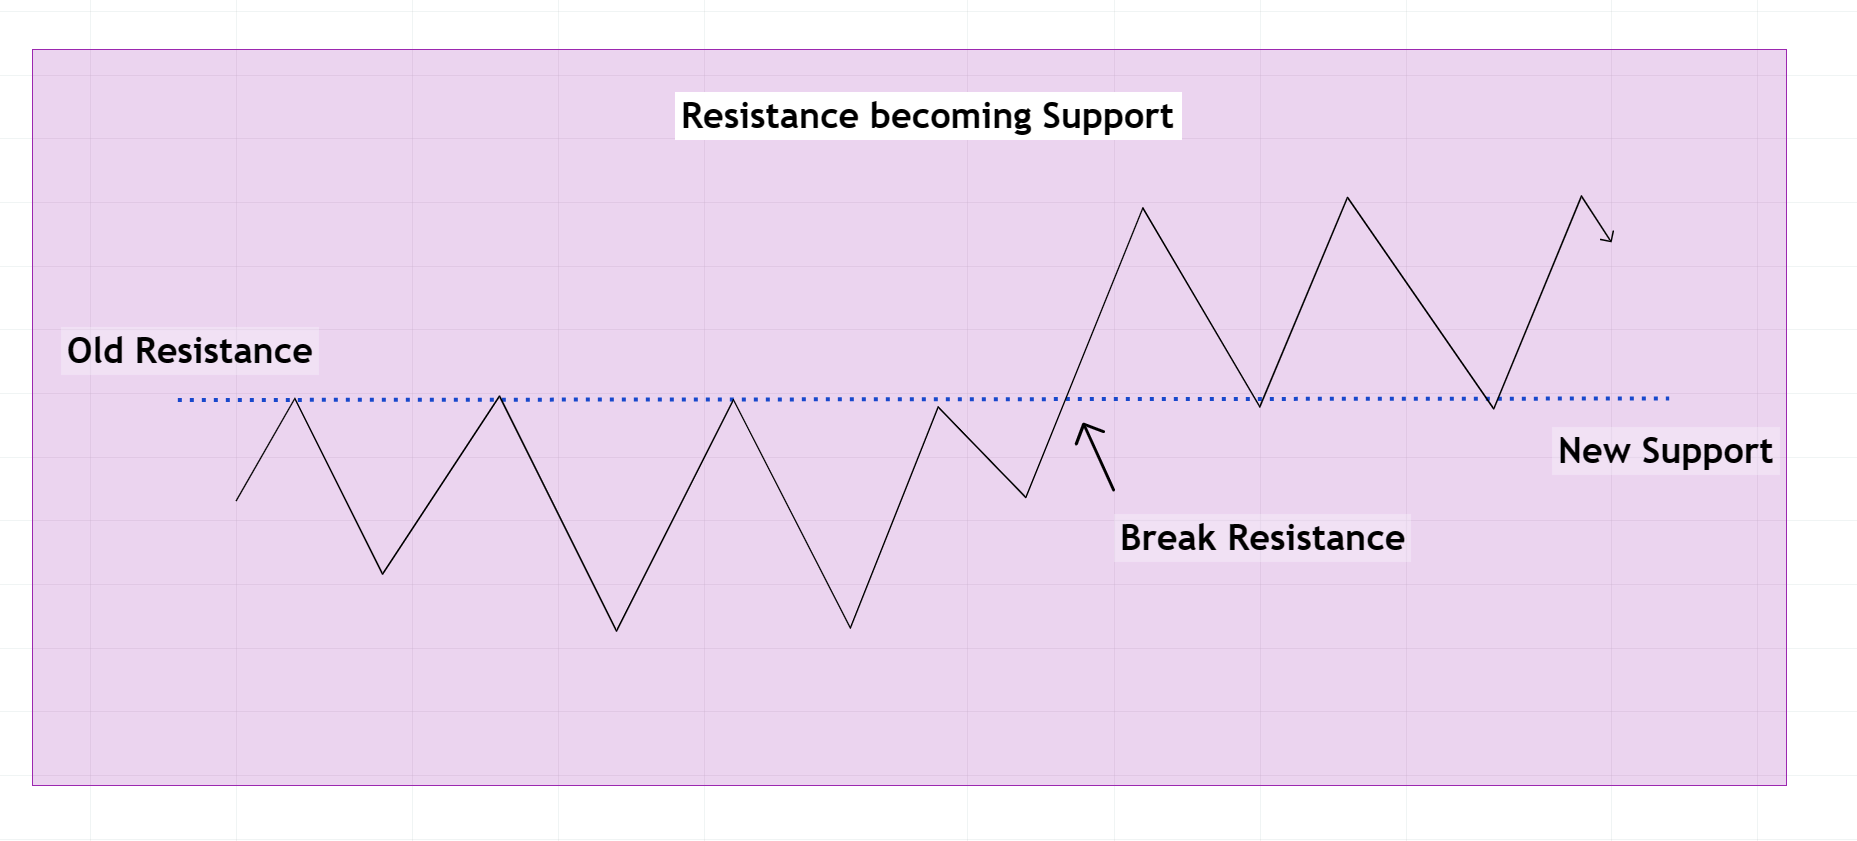
When the price passes through resistance, that resistance could potentially become support.
How to Find Support and Resistance Levels
Support and resistance levels are identified by analysing past price data and looking for situations where prices have previously reversed after declining or increasing. These levels can be further confirmed by looking at trading volume and other technical indicators like RSI.
Past Data Analysis
- Find Swing Highs and Lows: highs and lows on a price chart denote potential resistance and support levels, respectively.
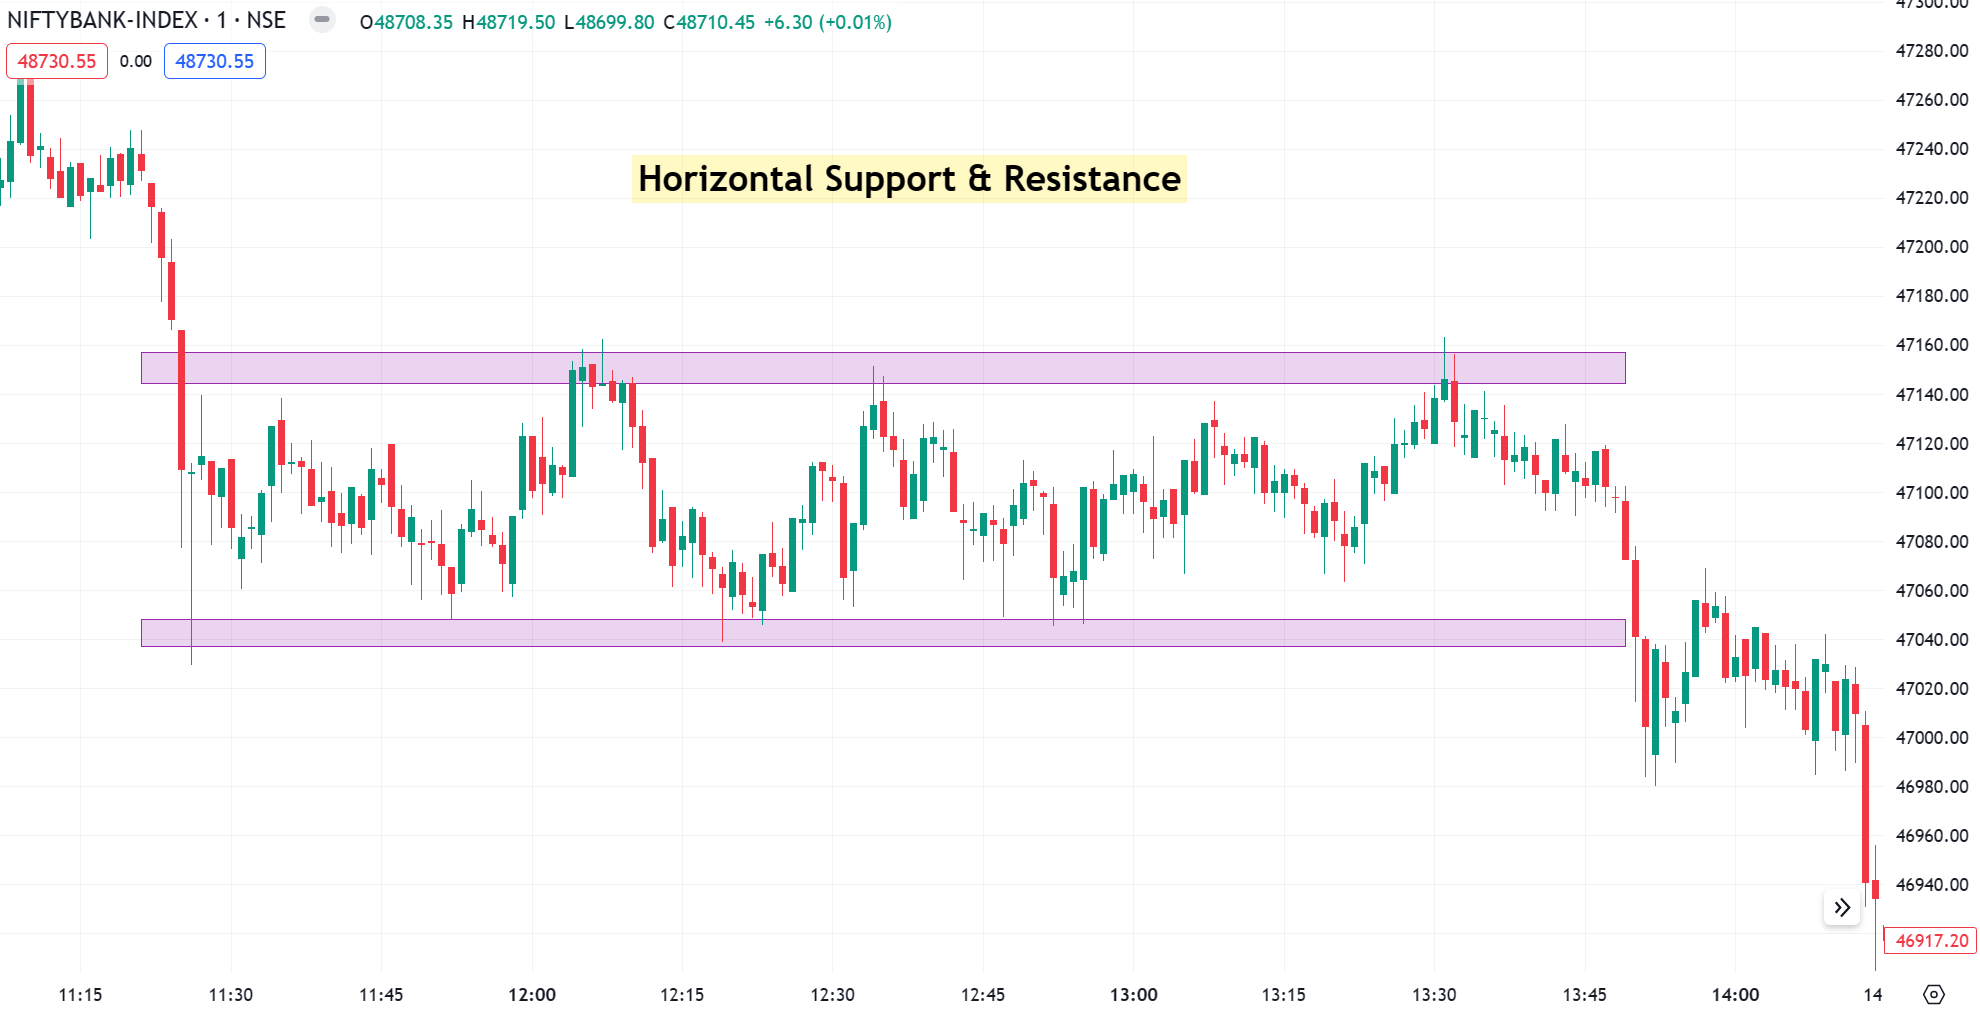
- Horizontal Zone: Horizontal zone drawn across significant price points, where the price has past reacted, can serve as support or resistance.
Trendlines
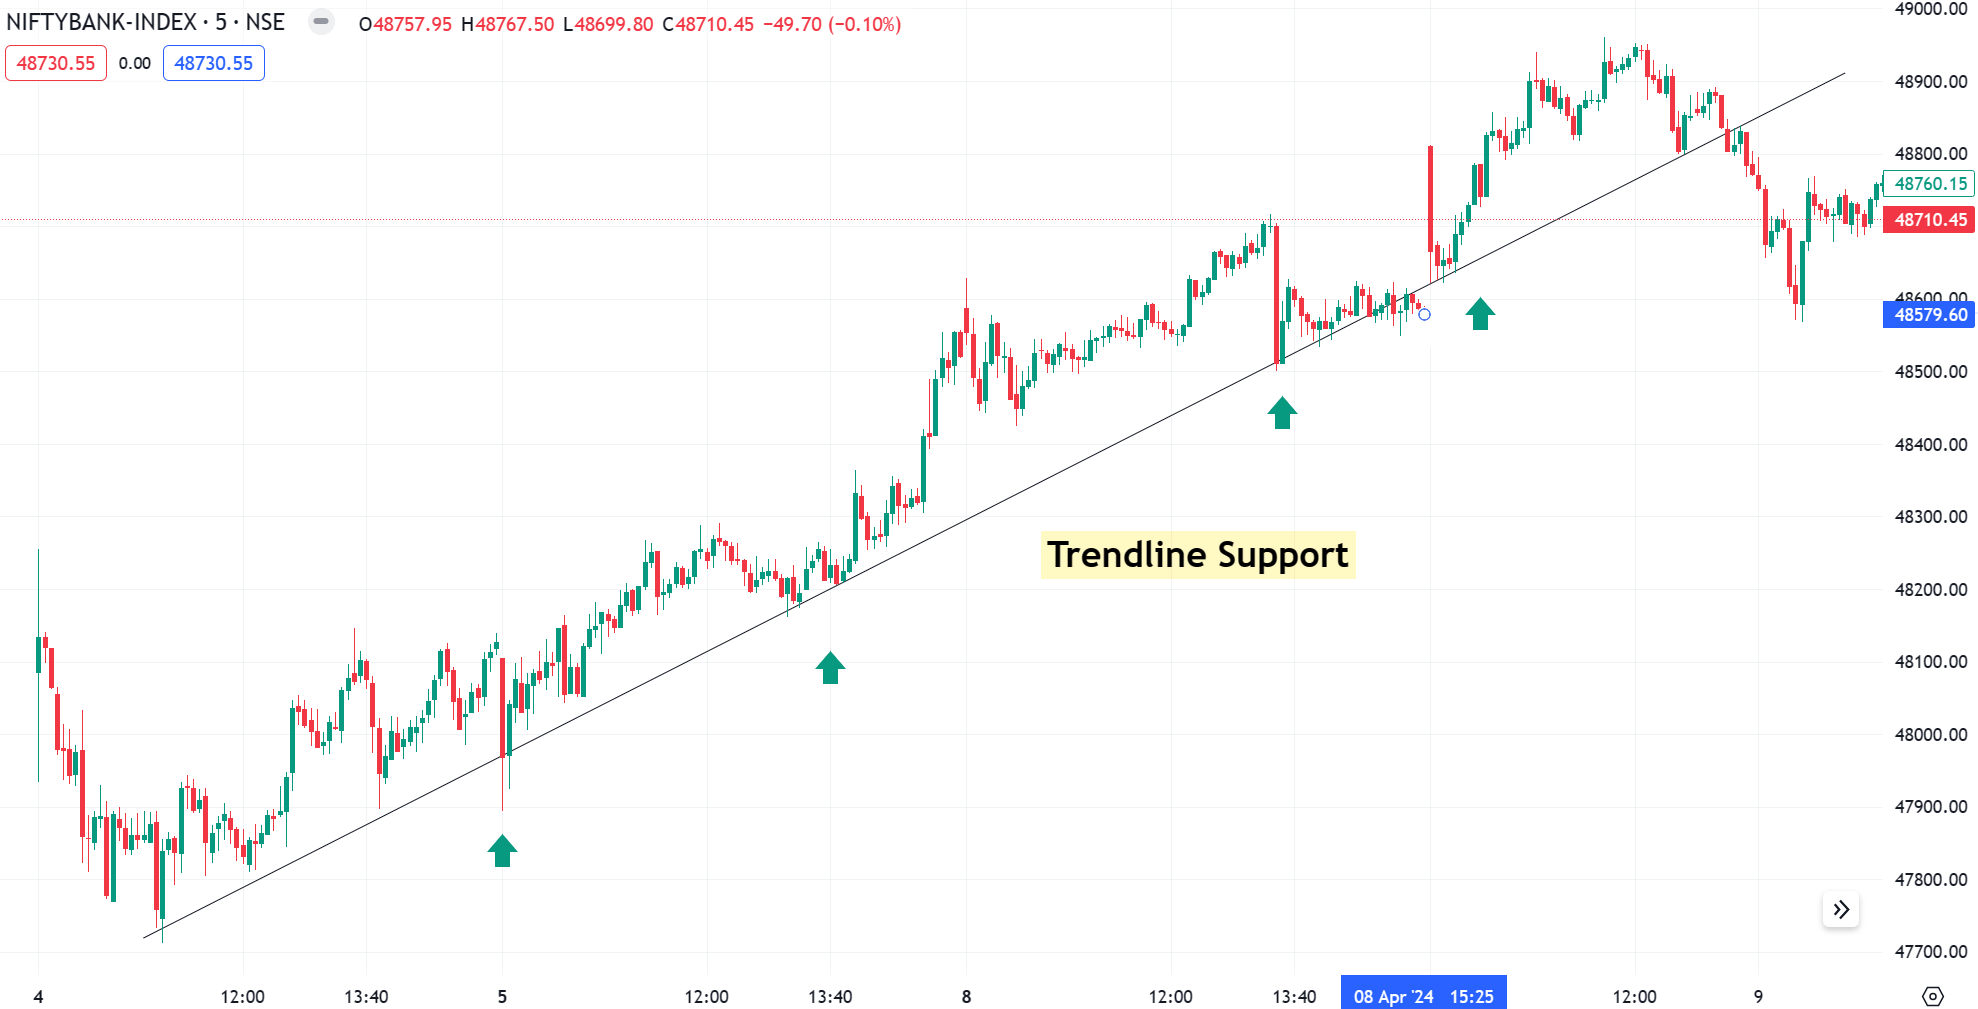
- Uptrend: Connects higher lows, forming a support line.
- Downtrend: Connects lower highs, forming a resistance line
Moving Averages
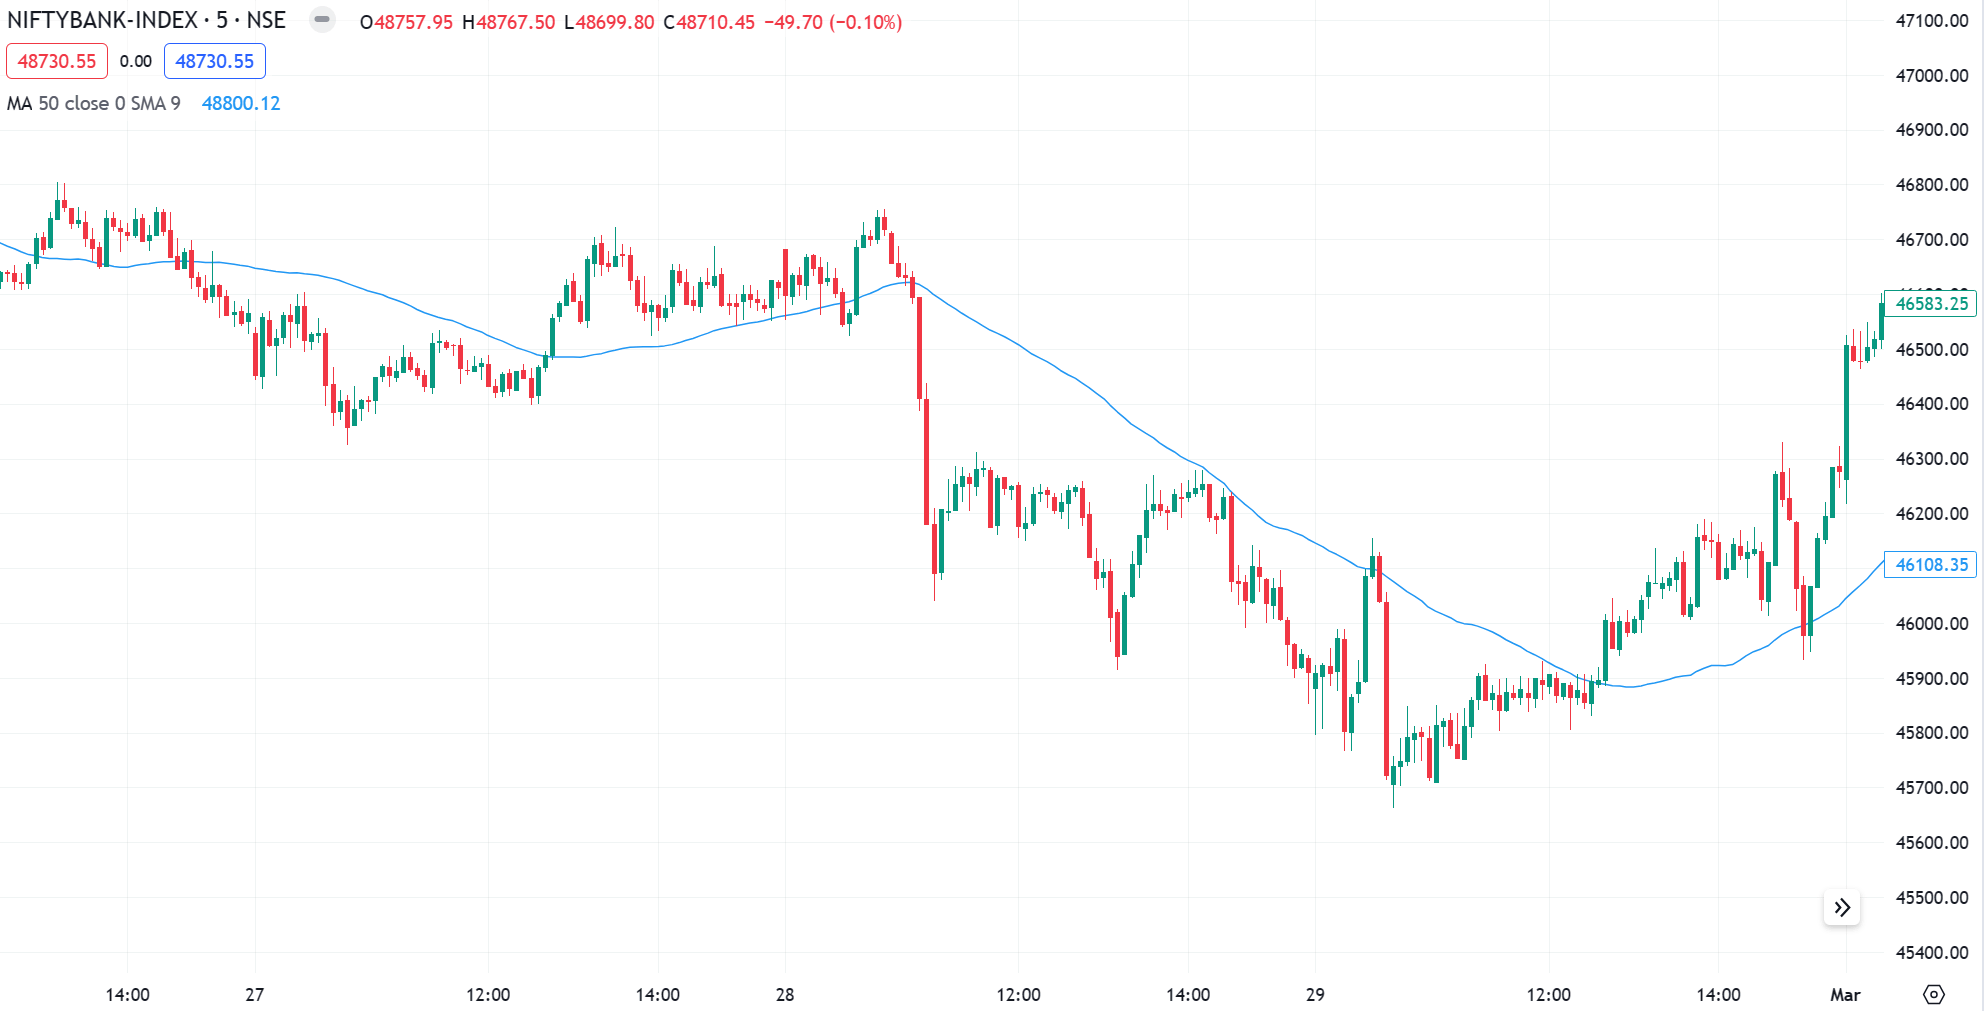
- Simple Moving Averages (SMA) and Exponential Moving Averages (EMA): These can act as dynamic support or resistance, especially during trending markets.
Psychological Levels
- Prices ending with zeros or fives often serve as psychological support or resistance levels due to human behavior and tendency to round figures.
One way you can find support and resistance levels is to draw an imaginary line on a chart that connects the lows and highs of a stock price. These lines can be drawn horizontally or diagonally.
Importantly, support and resistance levels are estimates and not necessarily exact prices. So try focusing on price zones when identifying support and resistance levels.
Type of Support & Resistance
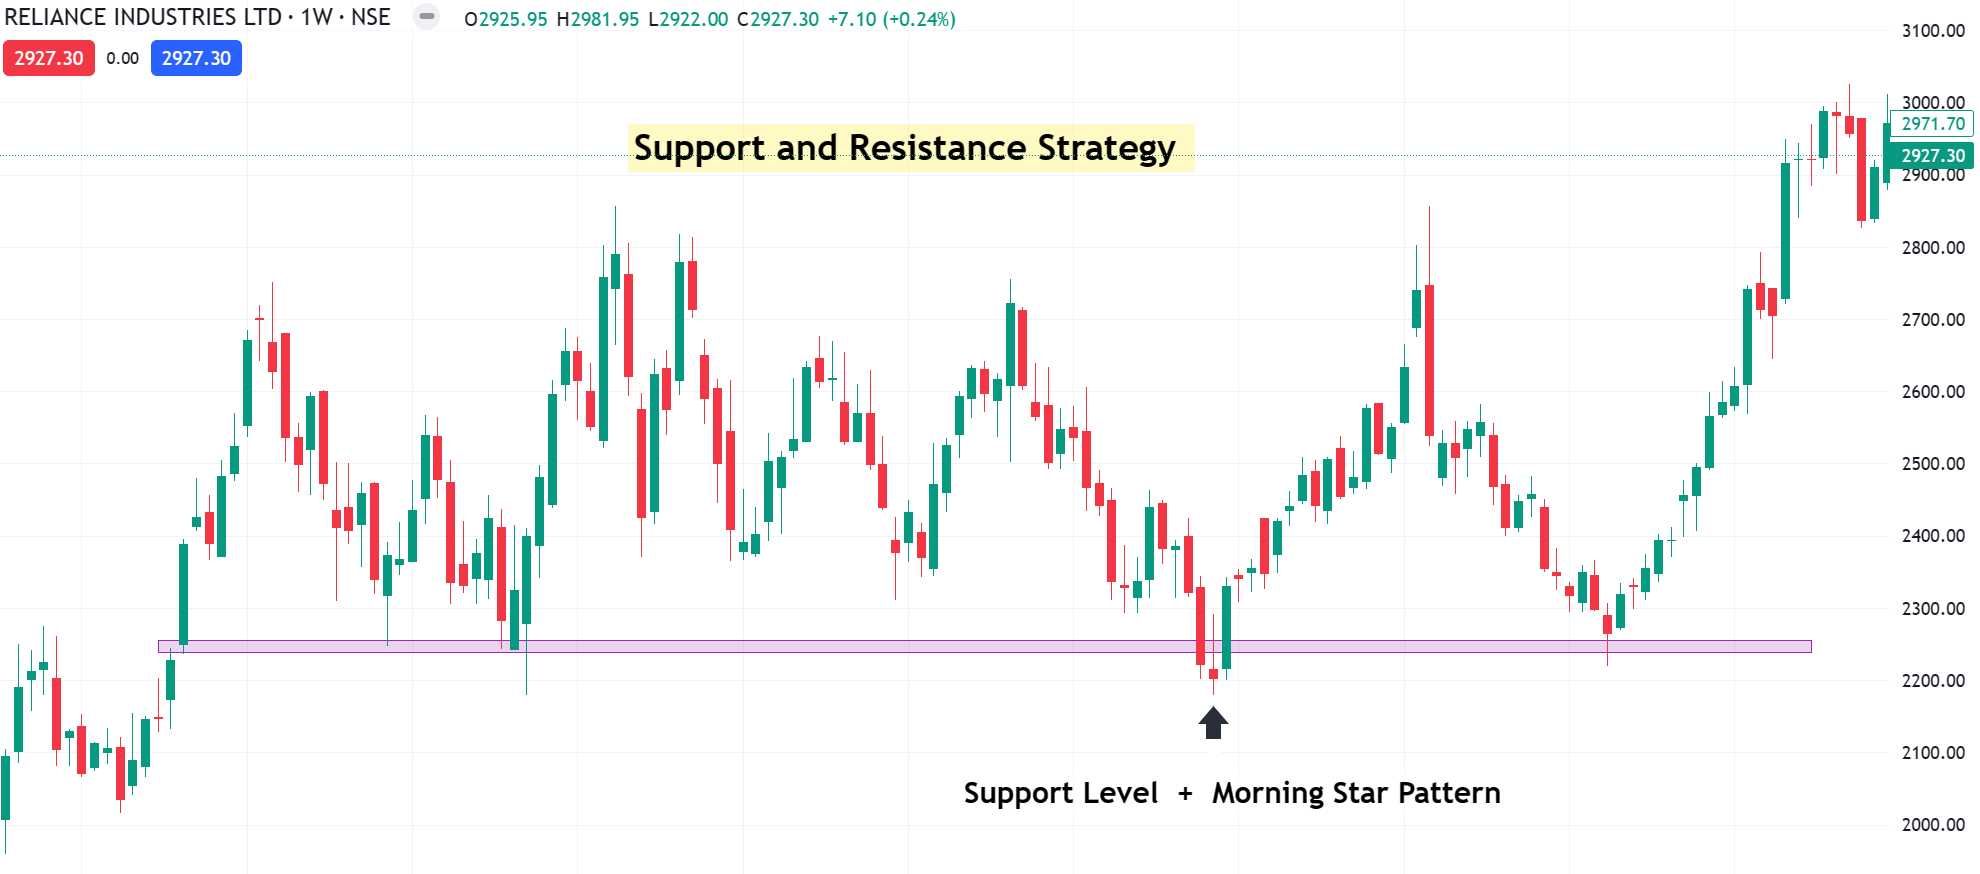
Horizontal Support and Resistance
Trendline Support / Resistance
Dynamic Levels using Moving Averages
How to Trade with the help of these Levels
Here is the basic trading concept to trade with support and resistance levels
Support and Resistance levels provide valuable insights for traders
Entry Point: When the price approaches a support level, it might be a good opportunity to buy in anticipation of a bounce. Conversely, nearing resistance could signal a potential selling opportunity.
Stop-Loss Placement: Traders can place stop-loss below support or above resistance to limit potential losses if the price breaks through the level unexpectedly.
Trade Confirmation: Wait for candlestick formation and place trade accordingly to get more accuracy.
Remember, Patience pays in trading. Stop chasing the markets and let price come to you.
Identify Breakouts
You can also know the breakouts so you don’t get “trapped” let’s learn breakout scenario
- Support break in a downtrend
- Resistance break in an uptrend
- Support and Resistance break when there’s a buildup move
Traders identify key support and resistance levels that stock test this zone multiple times. It signals a potential new uptrend, when the price breaks above go for long positions. Breakdowns below support are traded similarly for short positions.
Support and Resistance trading strategy
- Mark your areas of Support & Resistance
- Wait for a directional move with the help of a candlestick pattern
- Enter on the next candle with stop loss beyond the swing high/low
- Take profits at the previous swing
Range Trading: Buying at support and selling at resistance within a range-bound market.
Breakout Trading: Entering positions when price breaks above resistance or below support, anticipating a significant price movement.
Read: Candlestick pattern the complete guide
Read: Chart Patterns the Ultimate Guide
Final Words
This is what you’ve learned today
- Support and Resistance are areas or zones on your chart, not lines
- The more times Support and Resistance is tested, the weaker it becomes
- Support and Resistance can be identified using moving average
- A Support and Resistance trading strategy
By understanding support and resistance, you learn valuable concepts related to support and resistance. These concepts help identify potential entry or exit points in the market, aiding in decision-making.
Finally, don’t forget to refer to our Support and Resistance article whenever you’re stuck in a tough situation with your trades.
Leave a comment and share your thoughts with Trade Mint. Your feedback is most valuable!
Thank you for reading this complete article!
Happy Trading!
Reference: Support and Resistance Wikipedia


I need banknifty nifty sensex bankex level
If ur any service I want join sir.
Meraj Khan
7******7
Sorry but I suggest you to learn and start trading on your own. It will take time but you will get interest in it, first learn all the concepts, at worst start with small capital.
खूप छान माहिती आहे.
Thanks Kamlesh
Good ????????
True helpful