A popular quote in trading is, “The trend is your friend.”
Trend line trading is a popular and effective method, many traders use to identify the market direction, It doesn’t matter whether you are a day trader, swing trader or even a positional trader. Anyone can use a trendline concept. It helps you analyse the right entry and exit points based on trendline support and resistance levels and place profitable trades in the market. So, if you are a beginner and you wish to learn everything about trading using trendlines then this article is completely for you. Let’s start.
“Trend Line Trading” is one of the most widely used concepts in trading to identify opportunities.
This article will help you understand the meaning and concept of trendline treding and give you all the information you need to effectively use the concept and enjoy a more rewarding trading experience.
In this article, we will learn
- What is a trend line?
- The right way to draw trendlines correctly
- Identifying the market trends and conditions
- How to use Trendline perfectly?
- Trendline Breakout Strategy
- How to ride massive trends using a simple Trend Line technique
- How to use Trend Line and identify trend reversal
- Final Words
What is a trend line?
As the name suggests, a trendline is a line that indicates the trend or the direction of the financial assets. A Trend Line is a straight-sloping line drawn on a chart that connects several highs (uptrend) or lows (downtrend) of a price movement. It helps visualize the overall direction of the price and potential support or resistance zones.
In the last session, we learned the Support and Resistance Concept
So you know support and resistance is a horizontal area on your chart that shows buying and selling pressure. Now it’s the same for Trend Line. The only key difference is Trend Line isn’t horizontal but sloping showing the market’s actual trend.
Here’s a trendline example
Types of Trend Lines
Upward Trend Lines – An upward trend line is a trendline that slopes upwards, connecting a series of higher swing lows. It represents the overall upward movement of price, and shows upward buying pressure.
Downward Trend Lines – A downward trend line is a trendline that slopes downwards, connecting a series of lower swing highs. It represents the overall downward movement of price, shows downward selling pressure
Now before understanding specific trend line strategies and techniques, first learn how to draw a trend line correctly.
The right way to draw trendlines correctly
Three important points to draw a Trend Line correctly…
Identify the Trend: First identify whether the market is upward, downward, or range-bound (Sideways).
Connect Points:
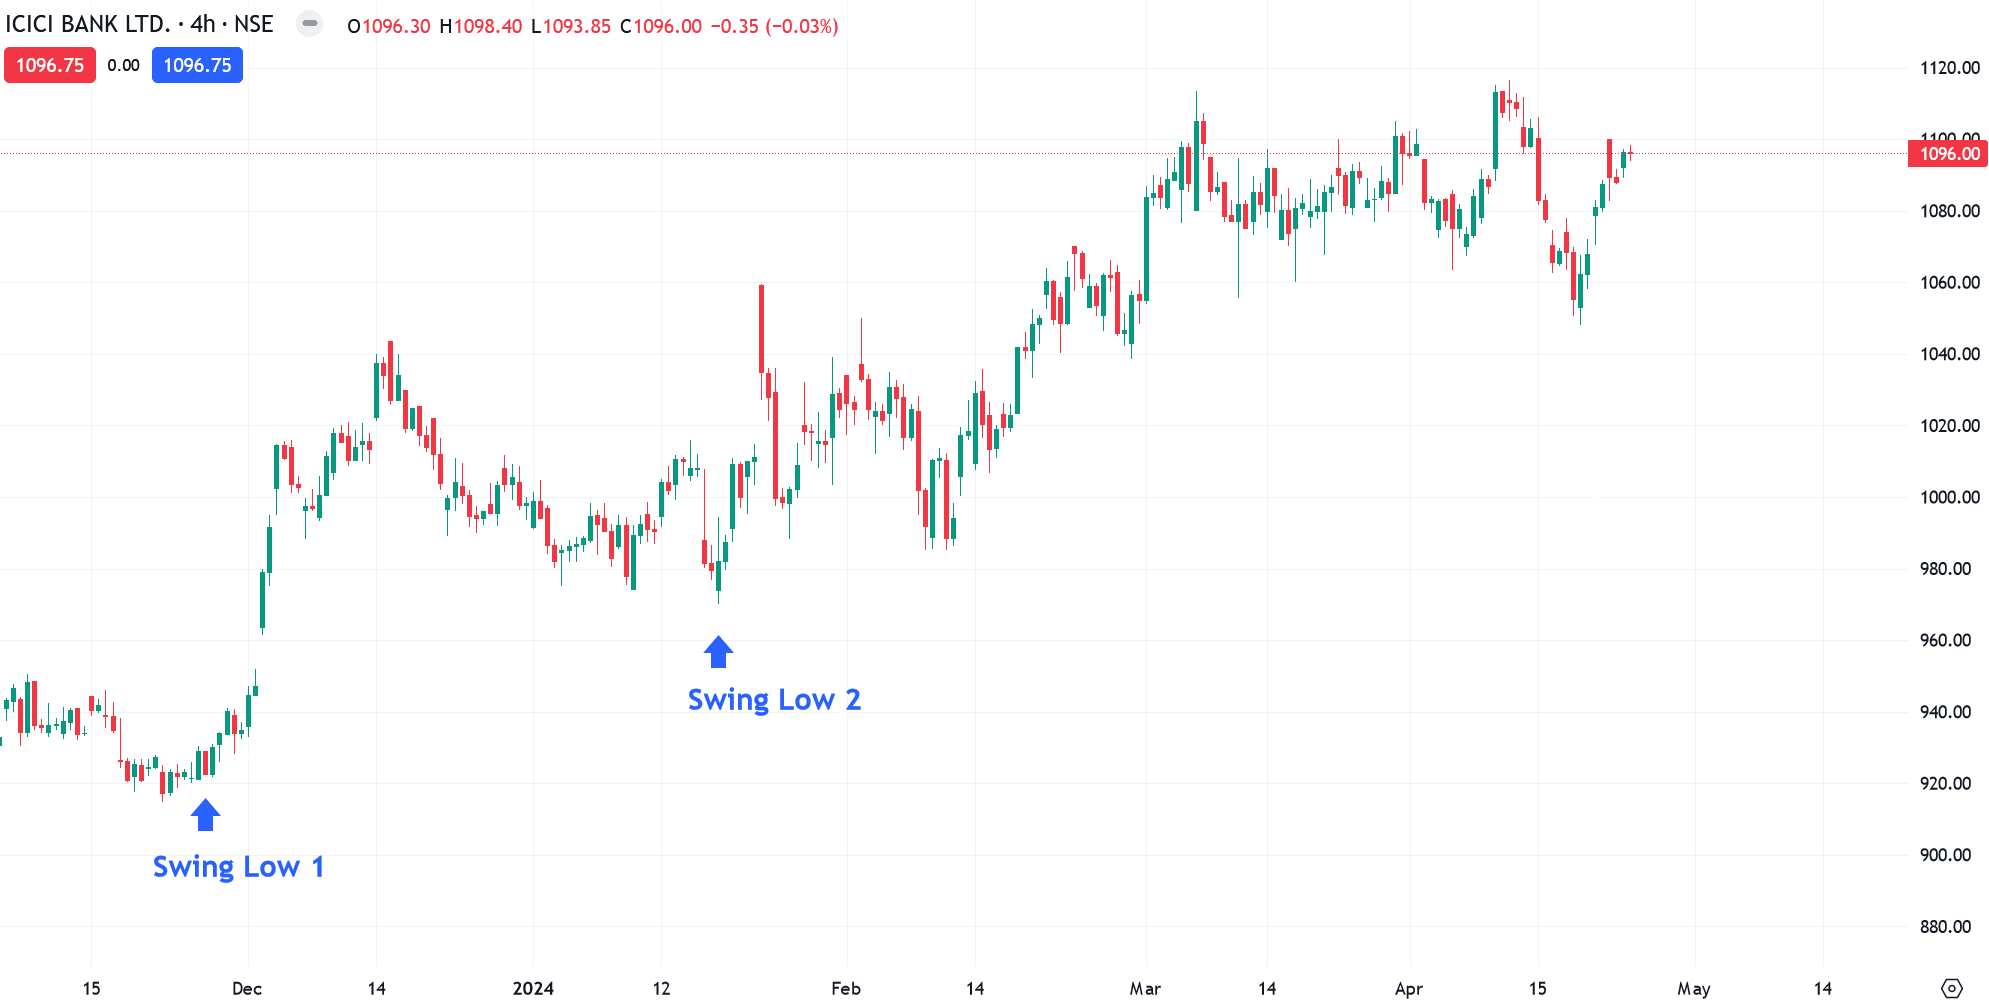
- For an uptrend, connect at least two major swing lows with a straight line.
- For a downtrend, connect at least two major swing highs.
Ensure that the line area touches the points as closely as possible without cutting through the body of the candlesticks. Wick touches are generally acceptable in the trendline.
Extend the Line: Extend this line and adjust it so that you get the most number of touches whether it’s body or wick is acceptable. also identify future potential areas of support or resistance.
The complete step-by-step example of how to draw trendlines correctly.
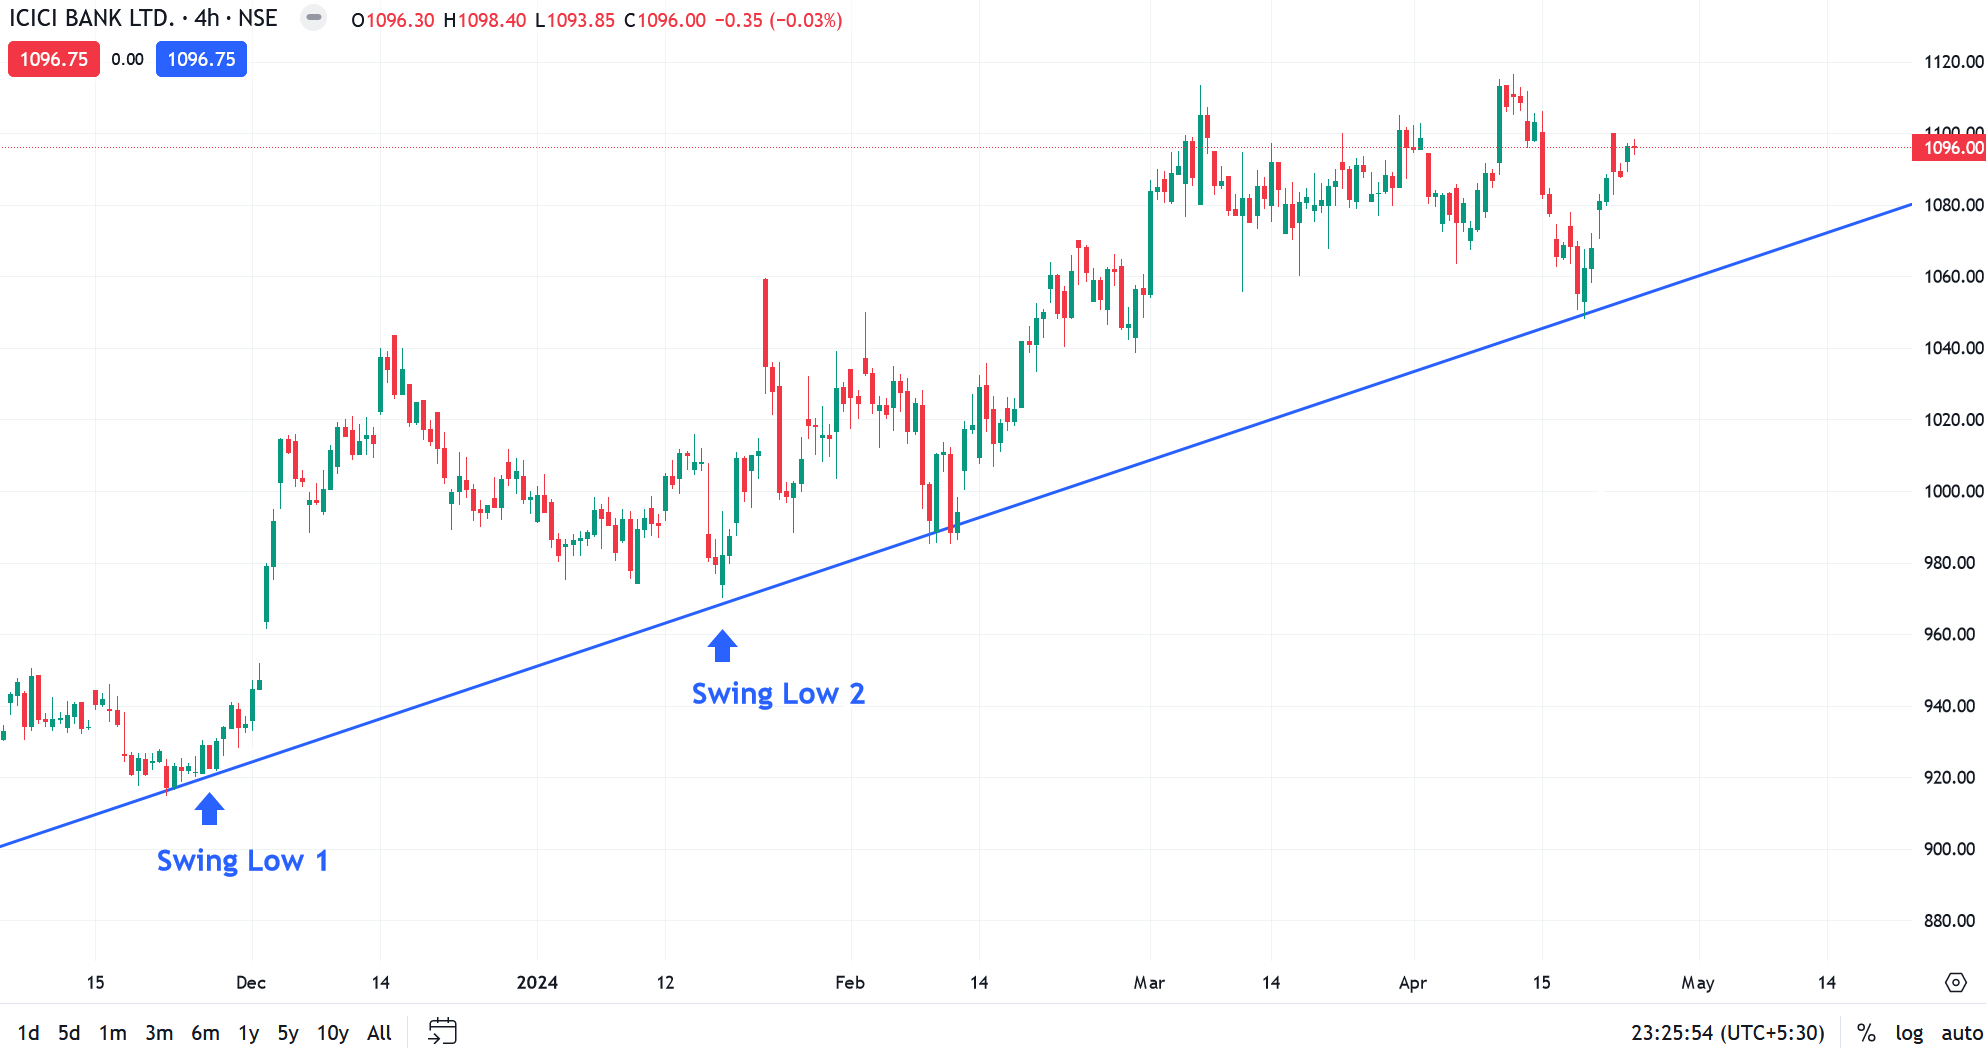
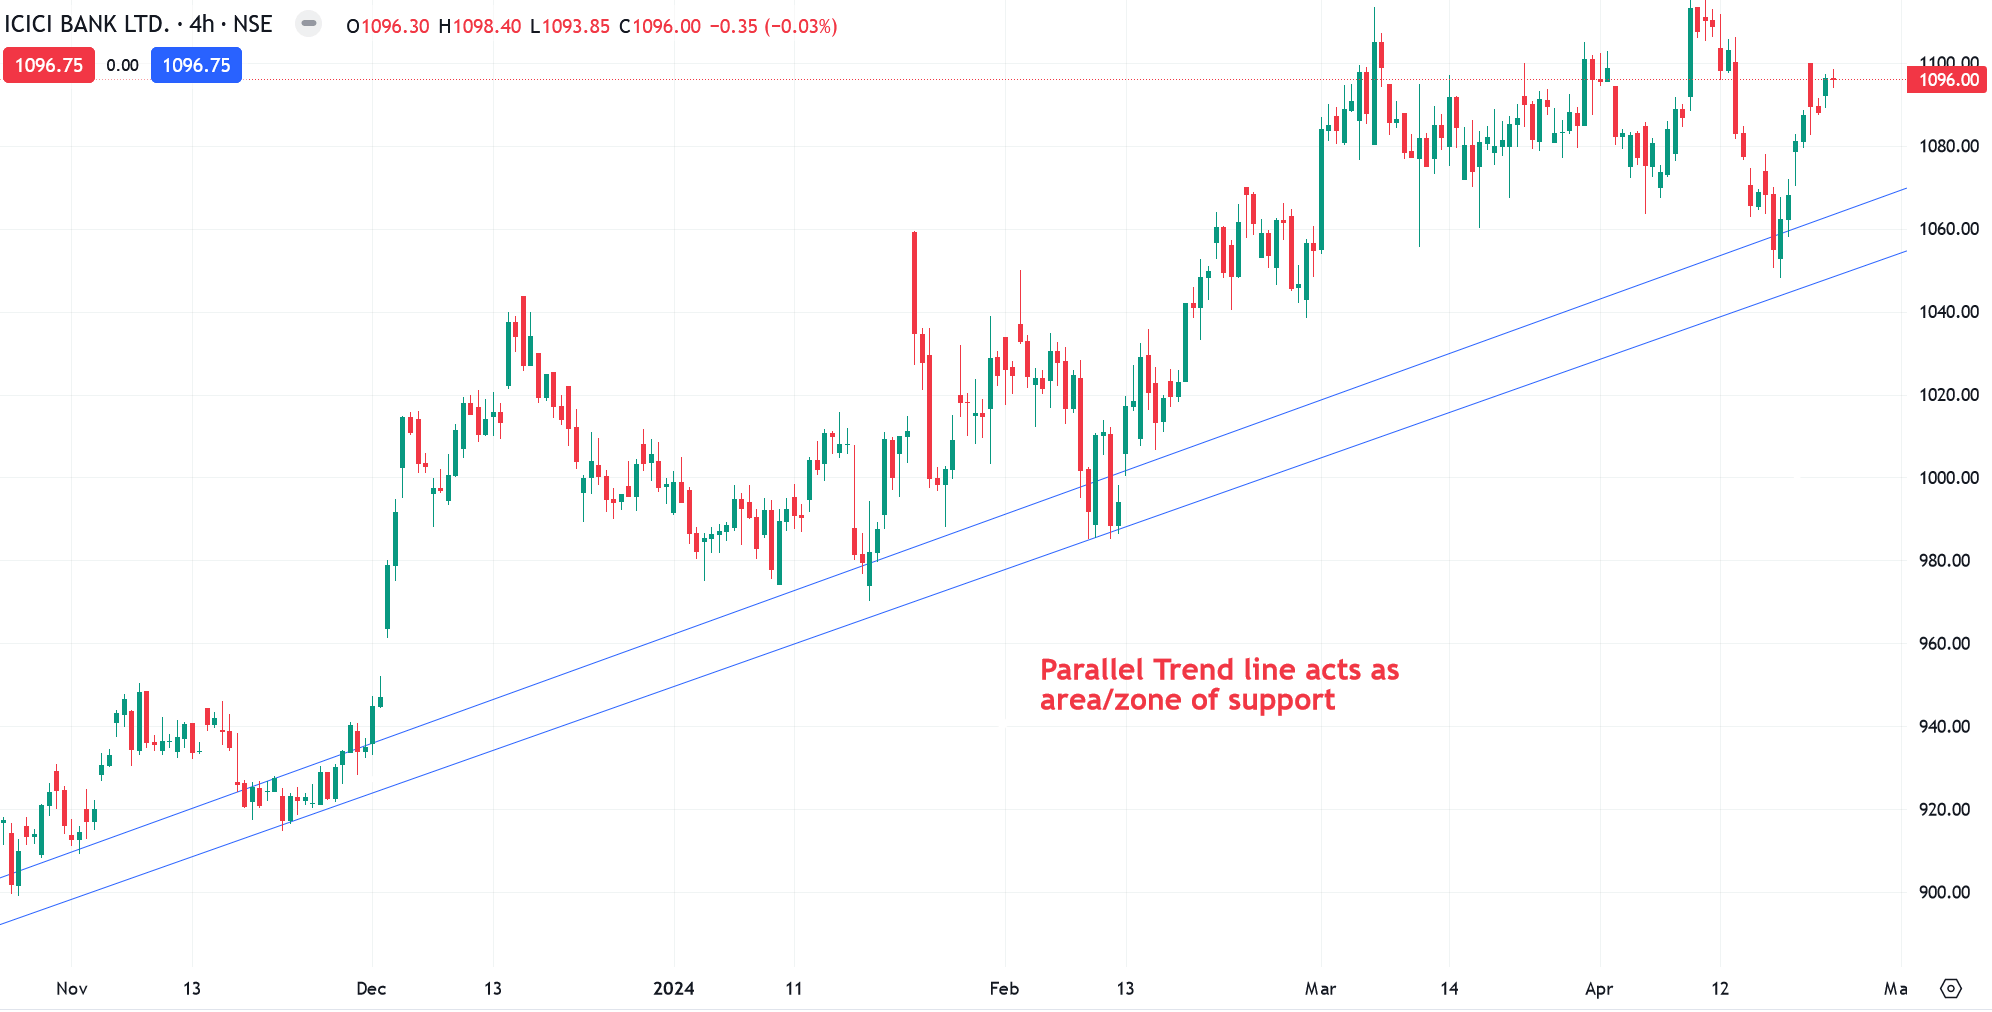
Pro Tip: You can draw two parallel trend lines to define the area/zone on your chart.
In the trend line when the price breaks and then instantly recovers so you need to “adjust” the Trend Line to fit the recent price action.
Remember Trend Line always needs “adjustment” so try and use area or zone to improve your trading
Here are some common mistakes to avoid when drawing trend lines
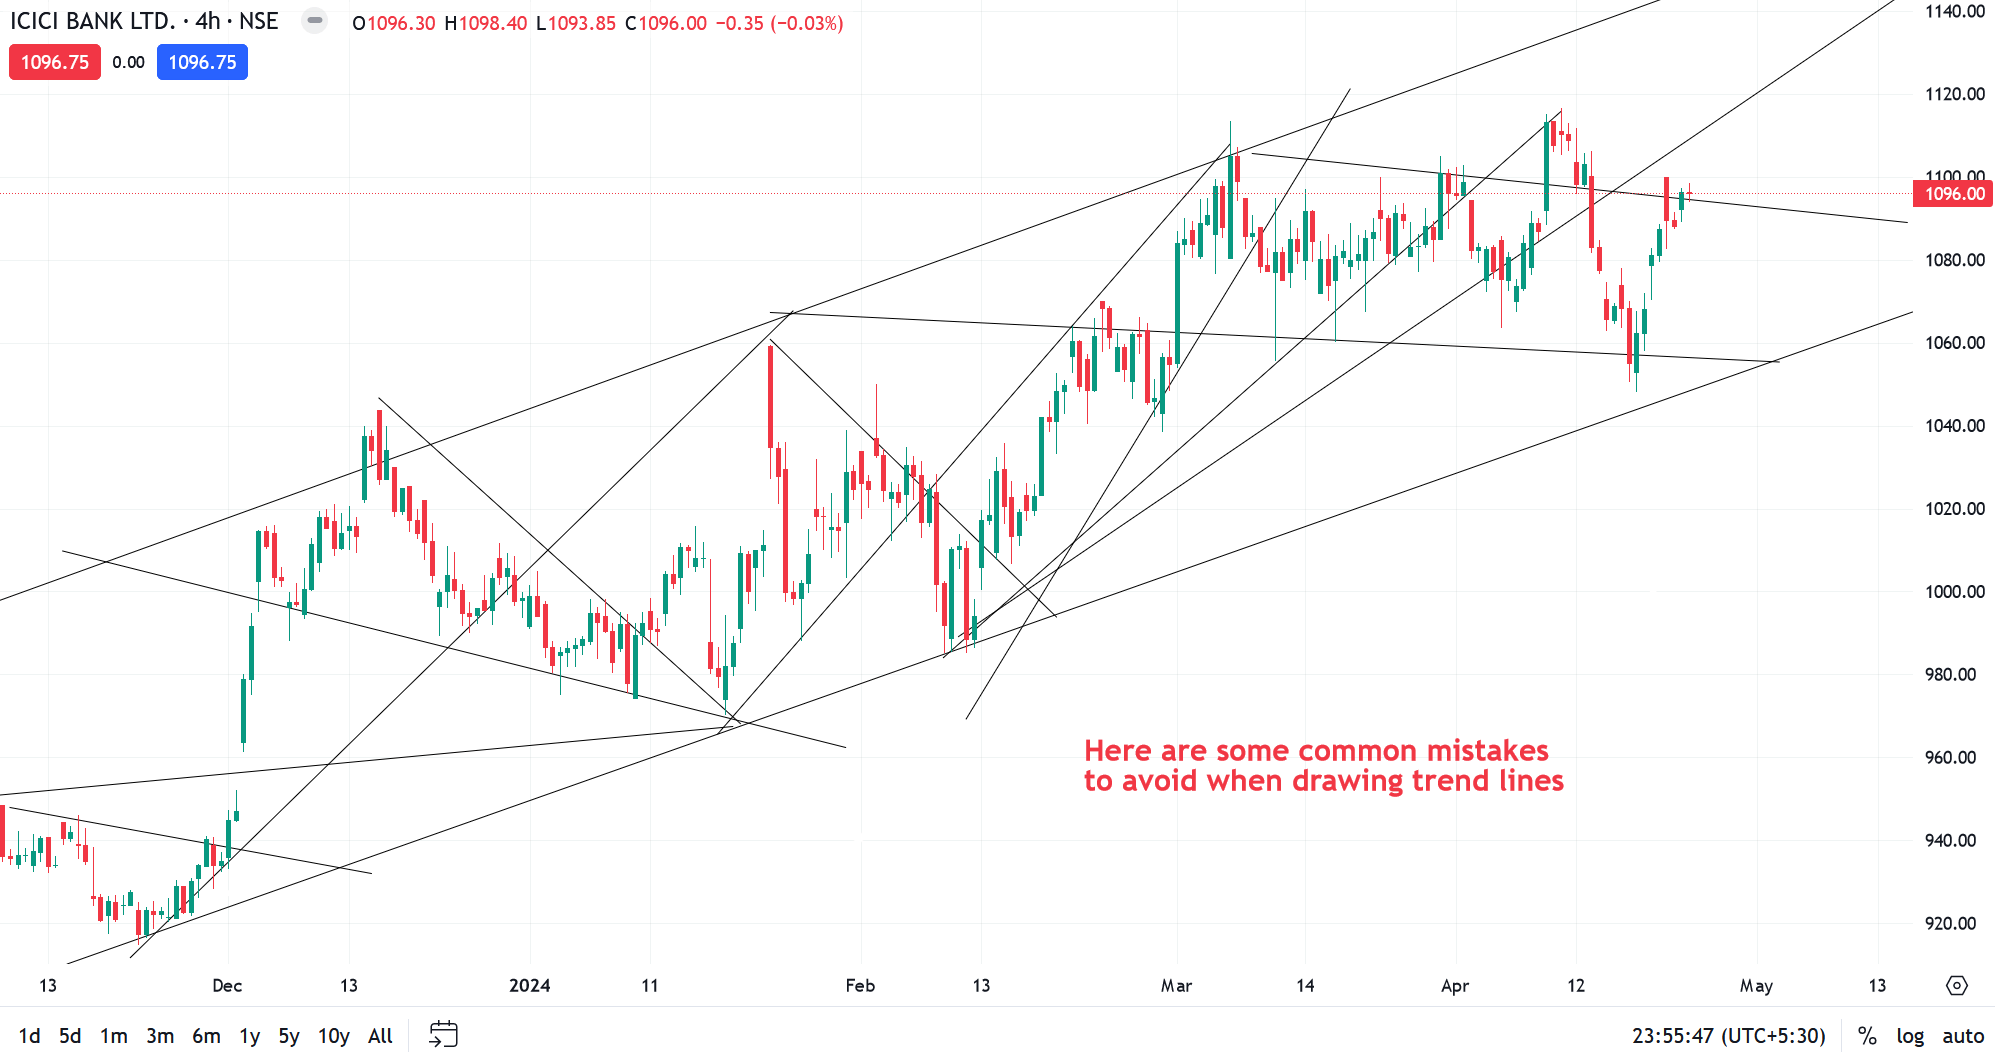
In the above example, we see this is clear garbage.
How do you know which Trend Lines is most important? And which types of Trend Lines to ignore?
You’ve no idea. so please don’t draw like this try to focus on only important trend lines and remove all garbage.
Identifying the market trends and conditions
Identifying market conditions using the trendline is simple just ask the question yourself…
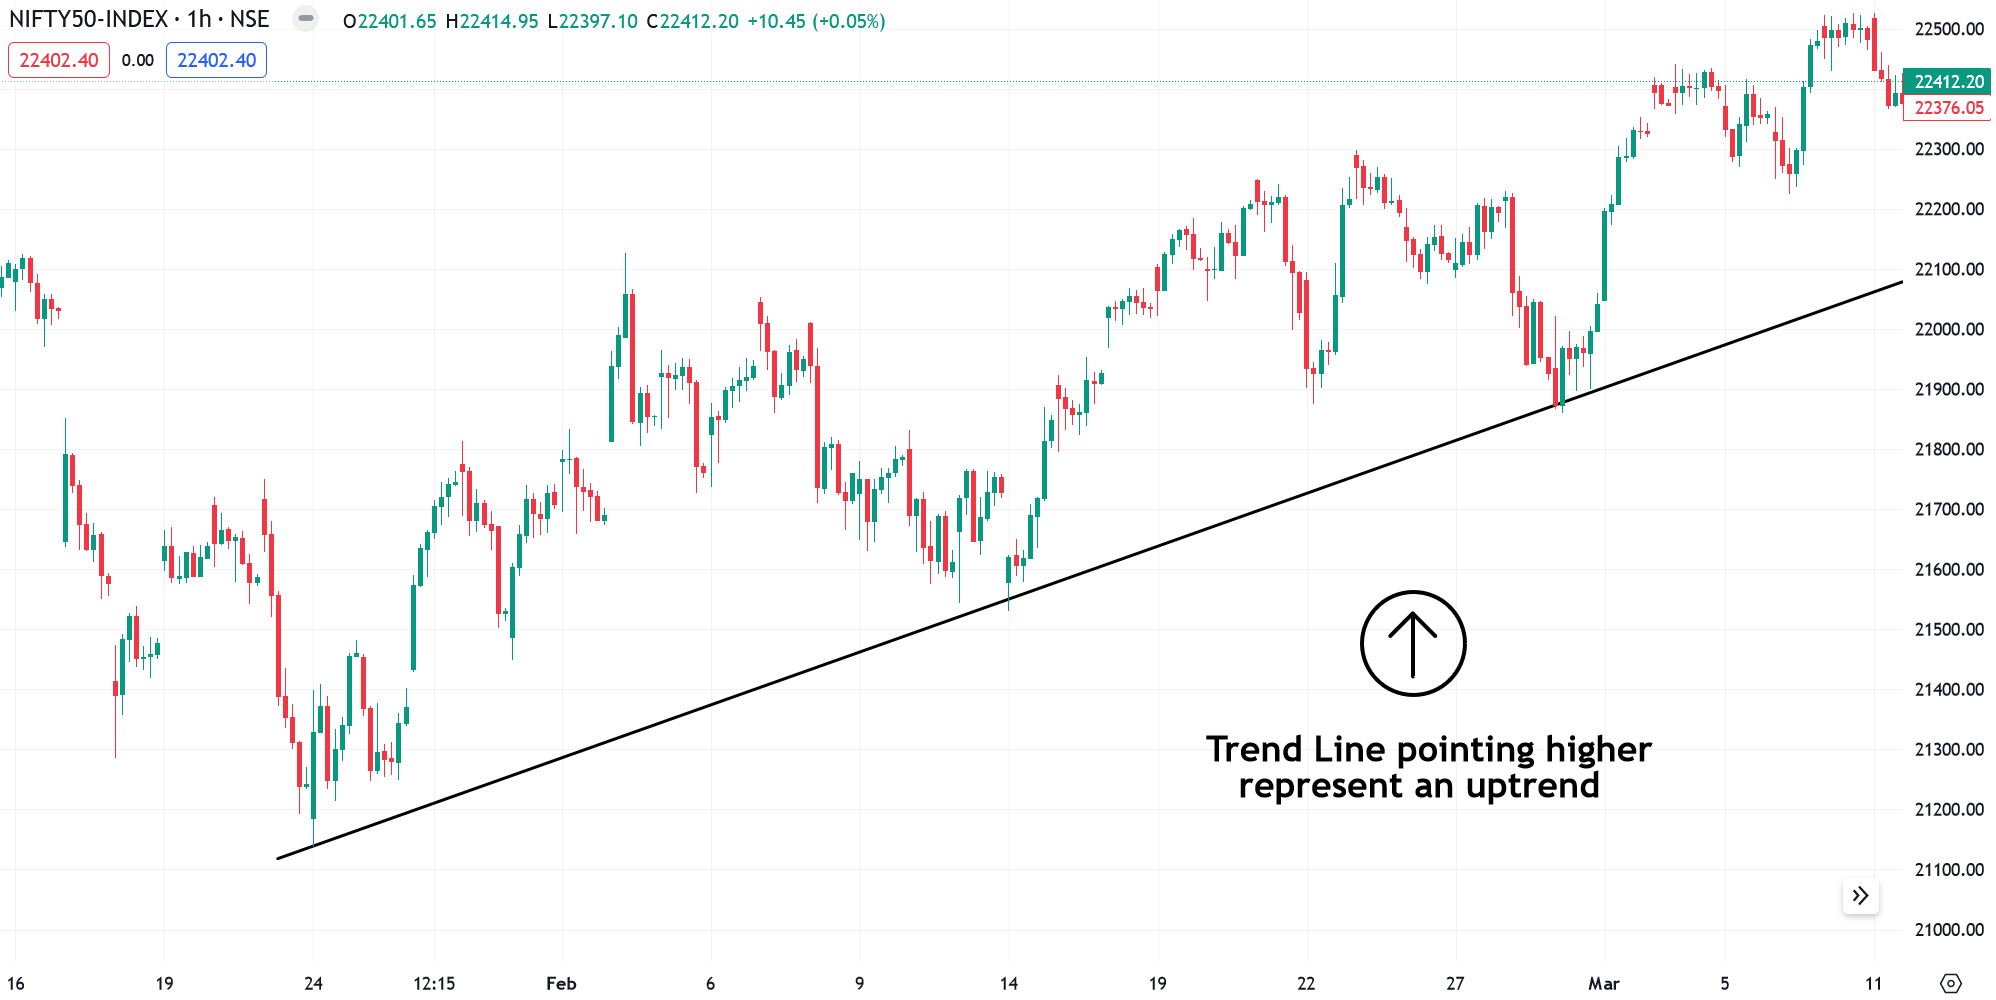
Is the Trend Line pointing higher or lower?
If it’s higher, then the market is in an uptrend & If it’s lower, then the market is in a Downtrend
Here’s a Nifty 50 Example that shows the market trend using the trendline technique
How to use Trendline perfectly?
When you find good trading opportunities using with trendlines, then you must trade near the area of Trend Line.
This allows you to have a tighter or small stop loss on your trades — which improves your risk-reward ratio.
But that’s not all ah…
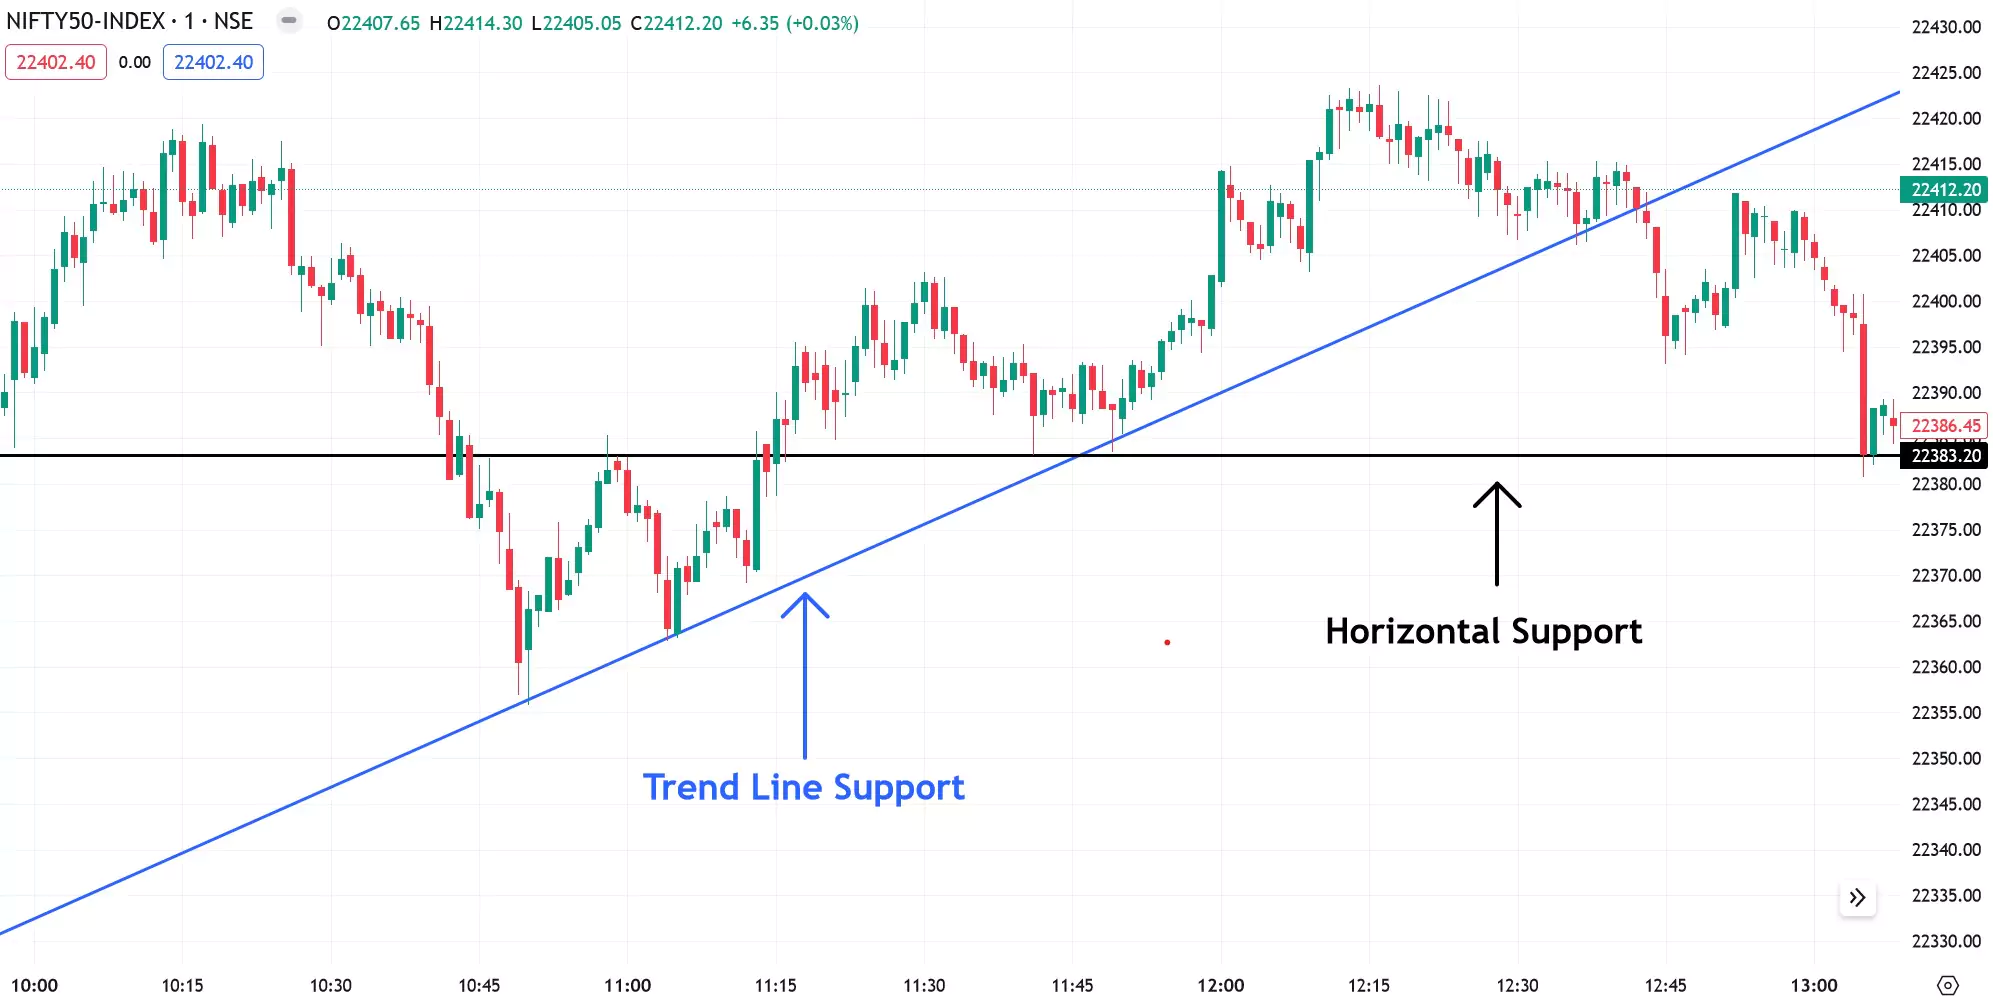
Because when you combine Trend Line with Support and Resistance, that’s where you find the best trading opportunities.
Here we explain what trendline trading essentially means

So when do I enter a trade?
Well, now you can use reversal candlestick patterns (like the Hammer, Bullish Engulfing, Moring Star, etc.) as your entry trigger.
This means you’re only entering a trade when the market has “bounced off” the Trend Line and is likely to move higher. you can refer to this image this includes multiple conformations that improve your profitability risk-reward ratio.
This guide improves your trading style – Learn 40+ Candlestick patterns Complete Guide
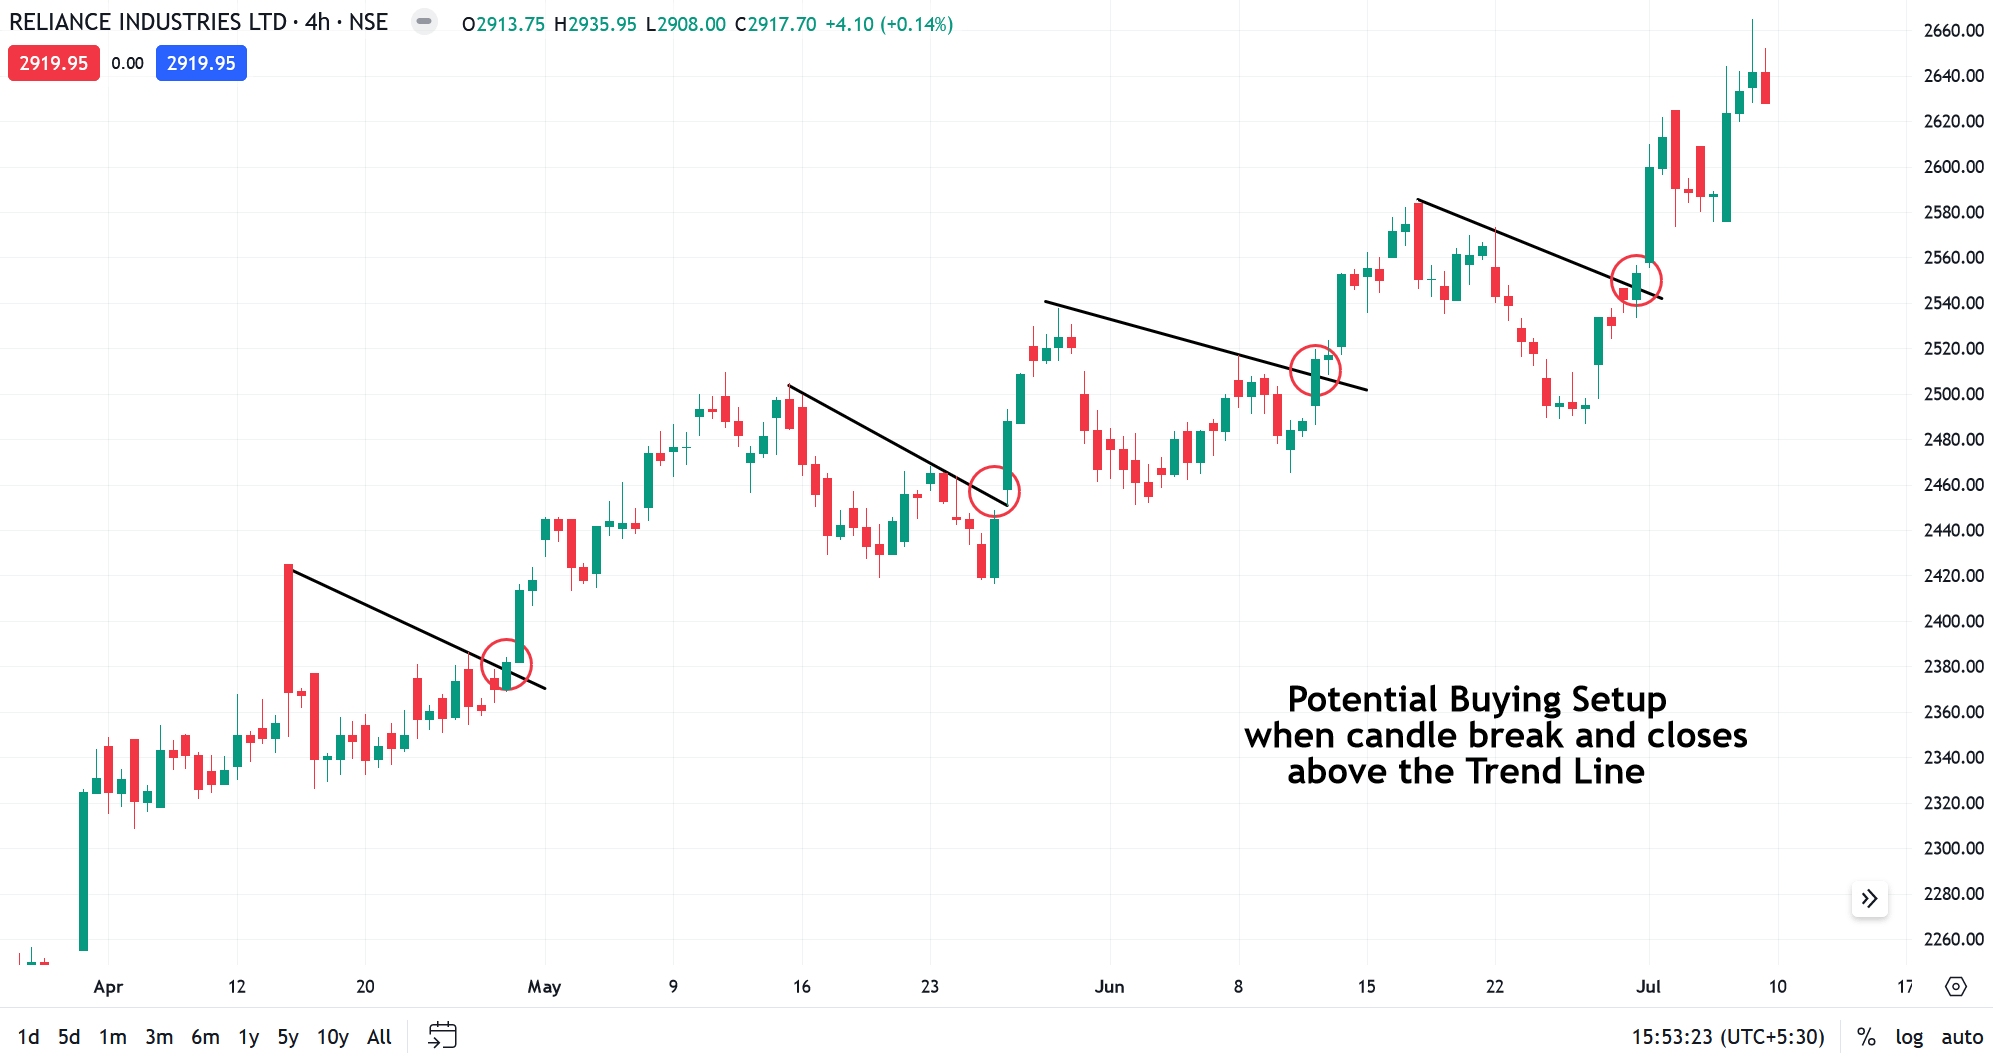
Trendline Breakout Strategy
Trade with the trend – The Trendline Breakout Strategy

How to ride massive trends using a simple Trend Line technique
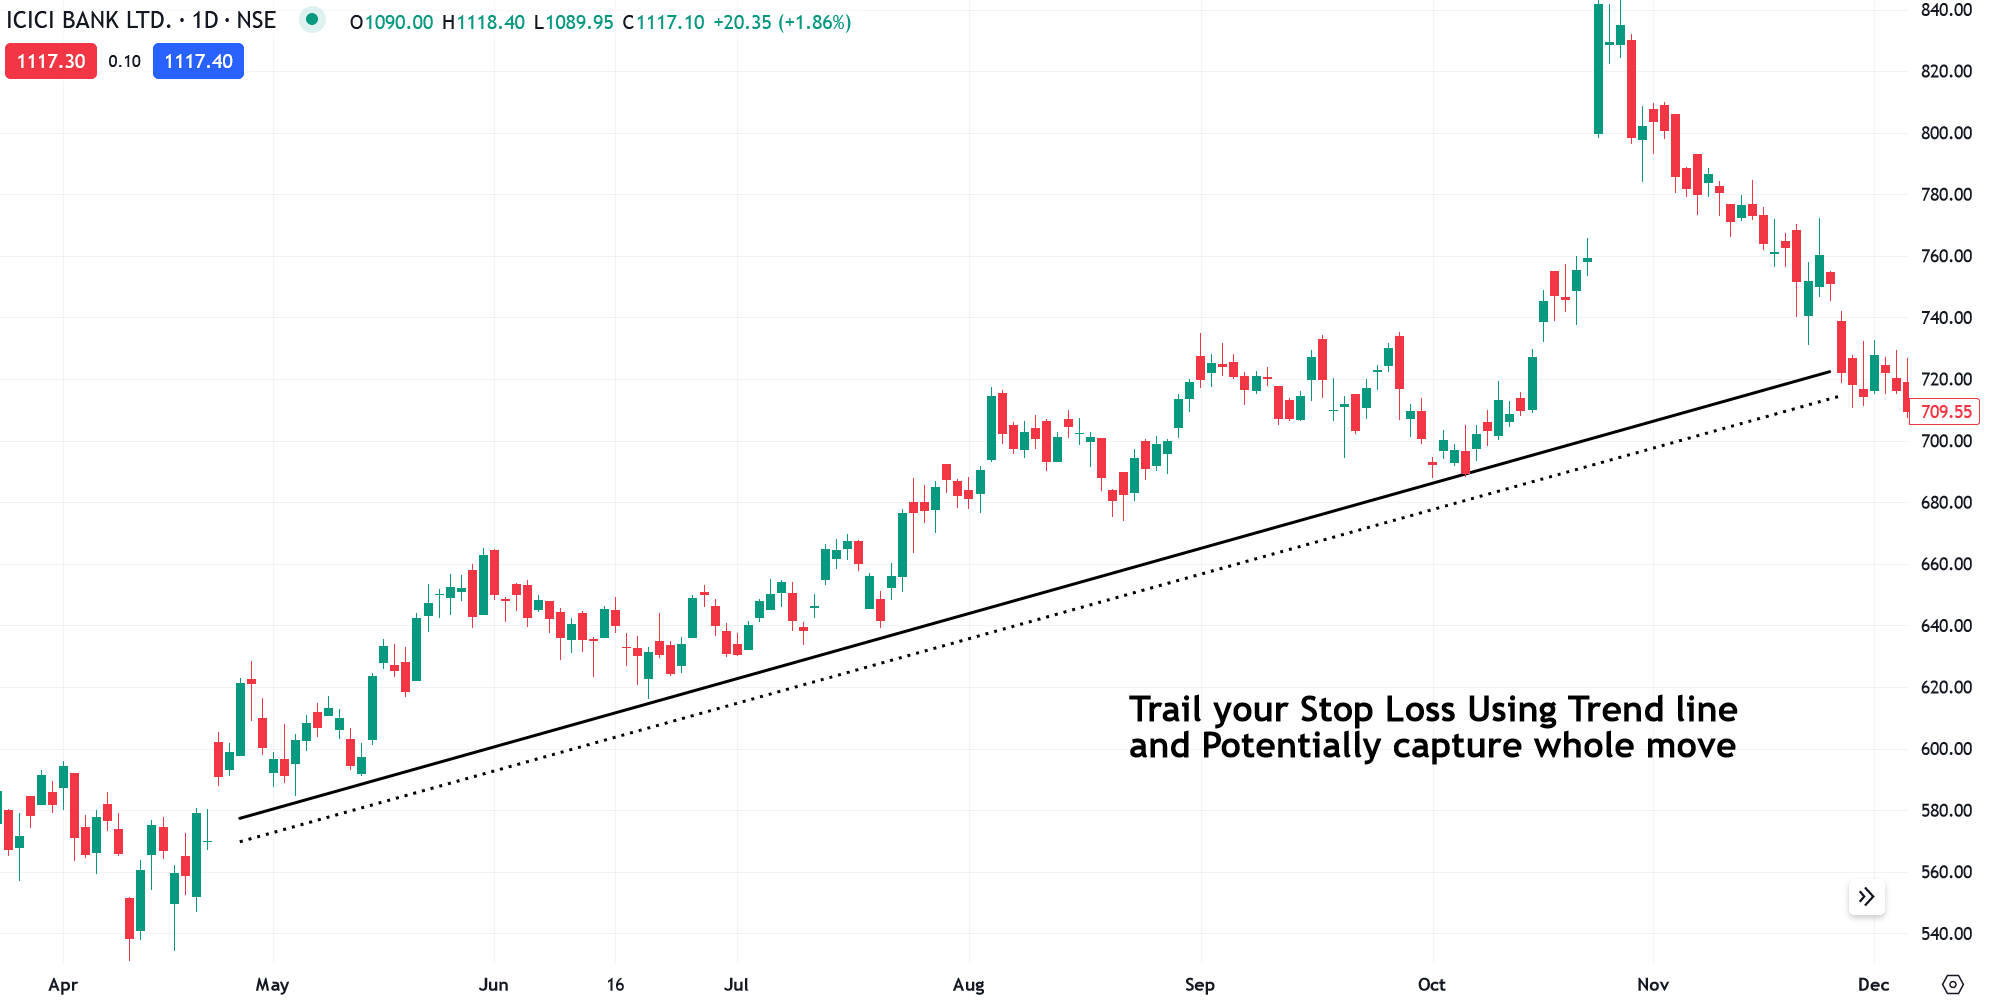
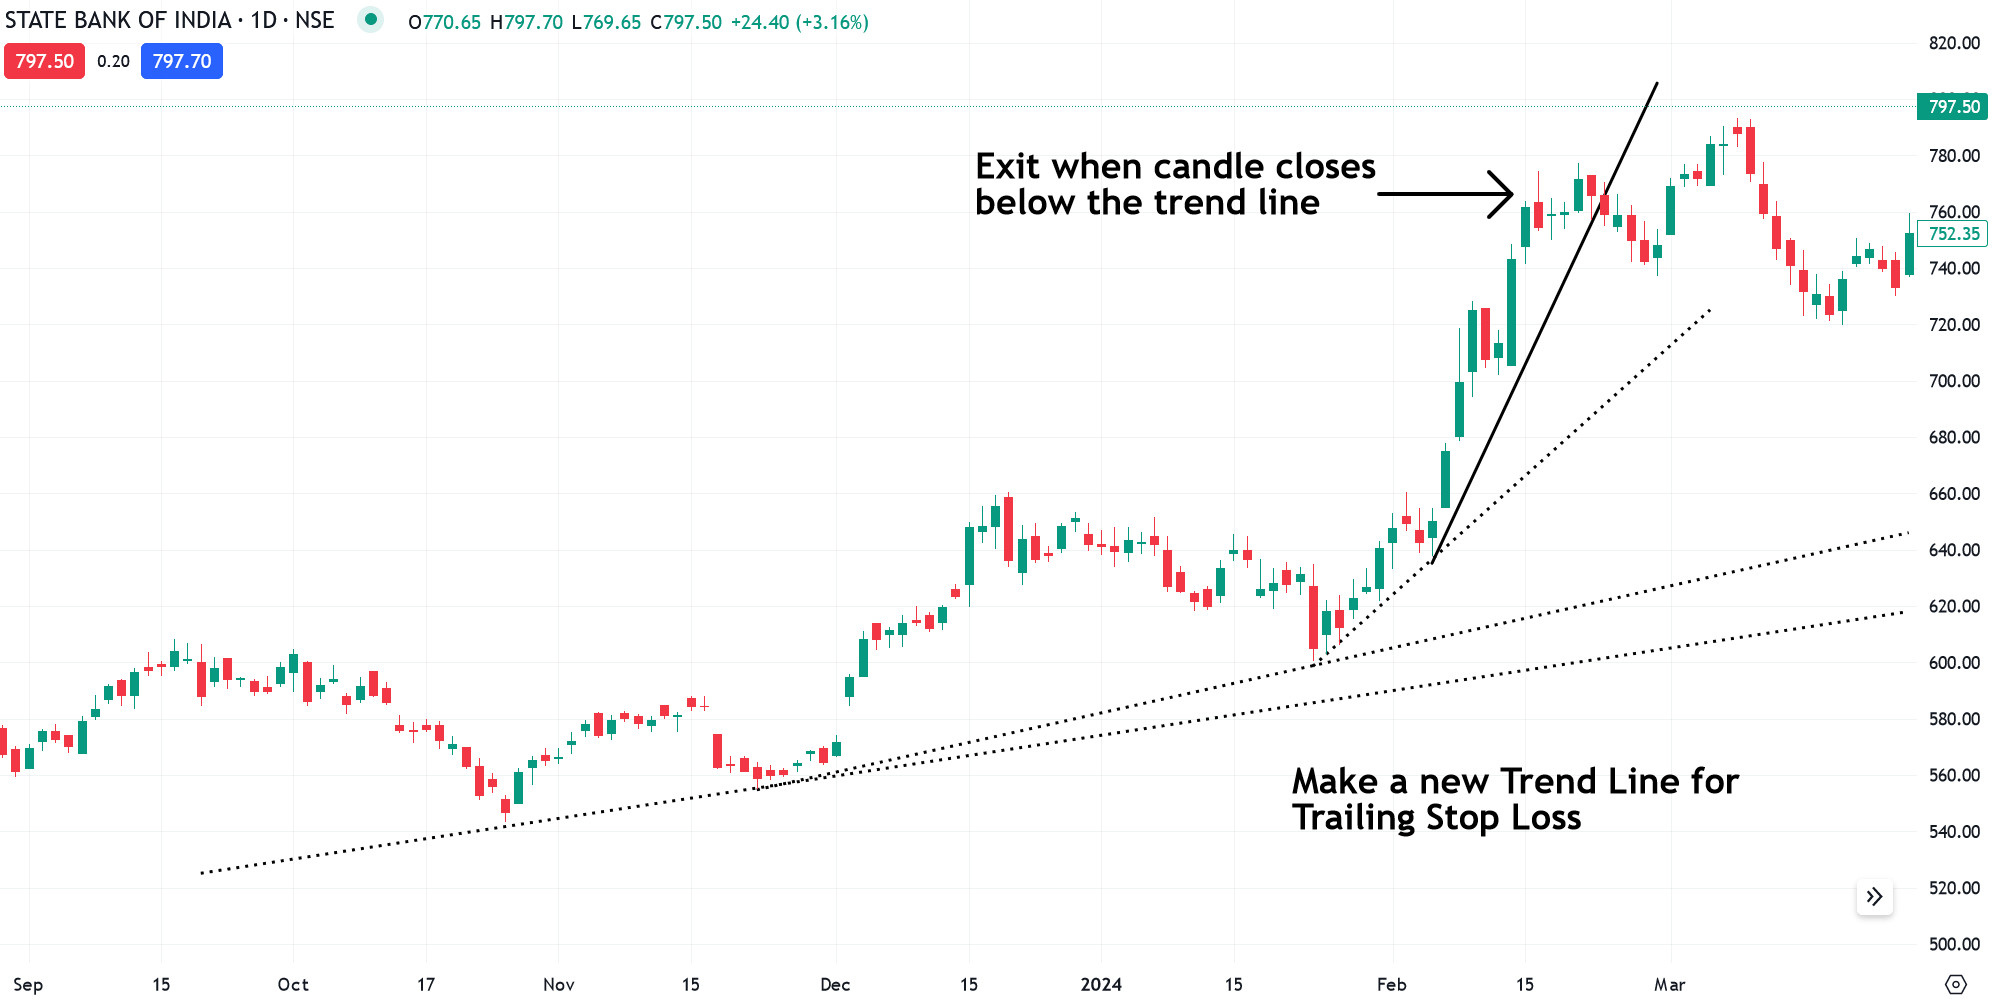
Riding massive trends using a simple trend line technique involves identifying strong trends early on and using the trend lines as guides for potential entry and exit points. This approach can help you capture a significant portion of the trend. Here’s how you can use trend lines to ride massive trends
- Draw an upward Trend Line
- Trail your stop loss below the Trend Line
- Exit the trade if the price closes below the Trend Line
In such cases, you want to trail your stop loss on the current market swing and exit the trade if the price closes below the trendline.
Here’s an best example of a parabolic trend where the types of trend lines are that of increasing steepness.…
Basic –
Trend Continuation Strategy
Entry: Look for the price to pull back (touch or come close to) the trend line.
In an uptrend, wait for a sign of reversal like higher lows forming before considering a long entry (buying).
In a downtrend, wait for a rejection (price reversal) at the trend line (acting as resistance) before considering a short entry (selling).
Exit: Exit the trade when the price breaks the trend line in the opposite direction of the trend (indicating a potential trend reversal) or when you reach your profit target
Advance –
How to use Trend Line and identify trend reversal
Just you’ve learned that a trend line needs regular adjustment with the market tends to have such a false breakdown.
So the important question is…
How do you identify a trend reversal?
Well, here’s a trendline 3-step technique for finding reversal so you can use it to improve your trendline trading strategy…
- Wait for the price to break (above the trendline if downward /below if upward) the trendline
- Wait for a higher low to form this tells you the sellers lose the momentum downward & Wait for a lower low to form this tells you the buyers lose the momentum upward.
- If the price breaks the recent swing, the market is likely to reverse so buyers/sellers are now in control
Here’s the complete scenario
Use the Chart Patterns to get deep confirmations, in the following example we use the Rising and Falling Channel patterns based on Trendline Concept
Learn advanced chart patterns that improve your trading phycology…

In this example, you see the price break the trend line and market change the direction

In this example, you see the price break the trend line and the market changes the direction
Important things to keep in mind: Trend Line Trading
- False Breakouts: Sometimes, the price might pierce the trend line slightly before reversing. Look for confirmation of the breakout (e.g., higher lows in an uptrend) before jumping into a specific trade.
- Trend Line Strength: The strength of a trendline is primarily based on the number of touches, angle of the trendline & length of the trendline.
- Use Multiple Timeframes: Drawing trend lines on different timeframes can provide a more comprehensive view of potential support and resistance levels.
- Confirmation: Be patient and wait for confirmation of the trend reversal before making any trading decisions.
Final Words
Trend lines are essential and a very basic tool that you must master before you start your trading journey. Learning to draw trendlines is indeed a skill. But, you must also have the ability to predict a strong trendline and a weak trendline. A strong trendline is a line where the price bounces back when it touches the trendline.
The practice of drawing trend lines and analysing market conditions regularly on different charts and different timeframes to refine your skills and win profitability.
Happy trading! ????????


