Bullish
Bearish
Continuation Patterns
Unlock the secrets of trading with our Candlestick Patterns The Complete Guide! Whether you’re a beginner or a pro, master the art of smart trading effortlessly.
Candlestick charts provide valuable insights into market sentiment and price movement so learn how candlesticks formed and decode the market together!
In this blog article, we will discuss all 40+ powerful candlestick patterns, but before that, let us discuss how to read candlestick charts.
Let’s start! Trade Smart!
What is a Candlestick Chart Pattern?
Candlestick patterns are one of the most powerful tools in the world of financial markets. First used in Japan in the early 16th Century to show prices and next Japanese began using technical analysis from the 17th century onwards, candlestick charts provide valuable insights into market sentiment and price movement dynamics.
A Candlestick pattern is a method of displaying the historical price movement of an asset over a given period of time.
Candlestick patterns are a visual or graphical representation of price movements in financial markets. They consist of one or more candlesticks that illustrate the open, close, high, and low prices for a specific time period. Traders use these patterns to analyze and predict market trends and future possibilities of the price direction.
This is how a candlestick chart pattern looks like:
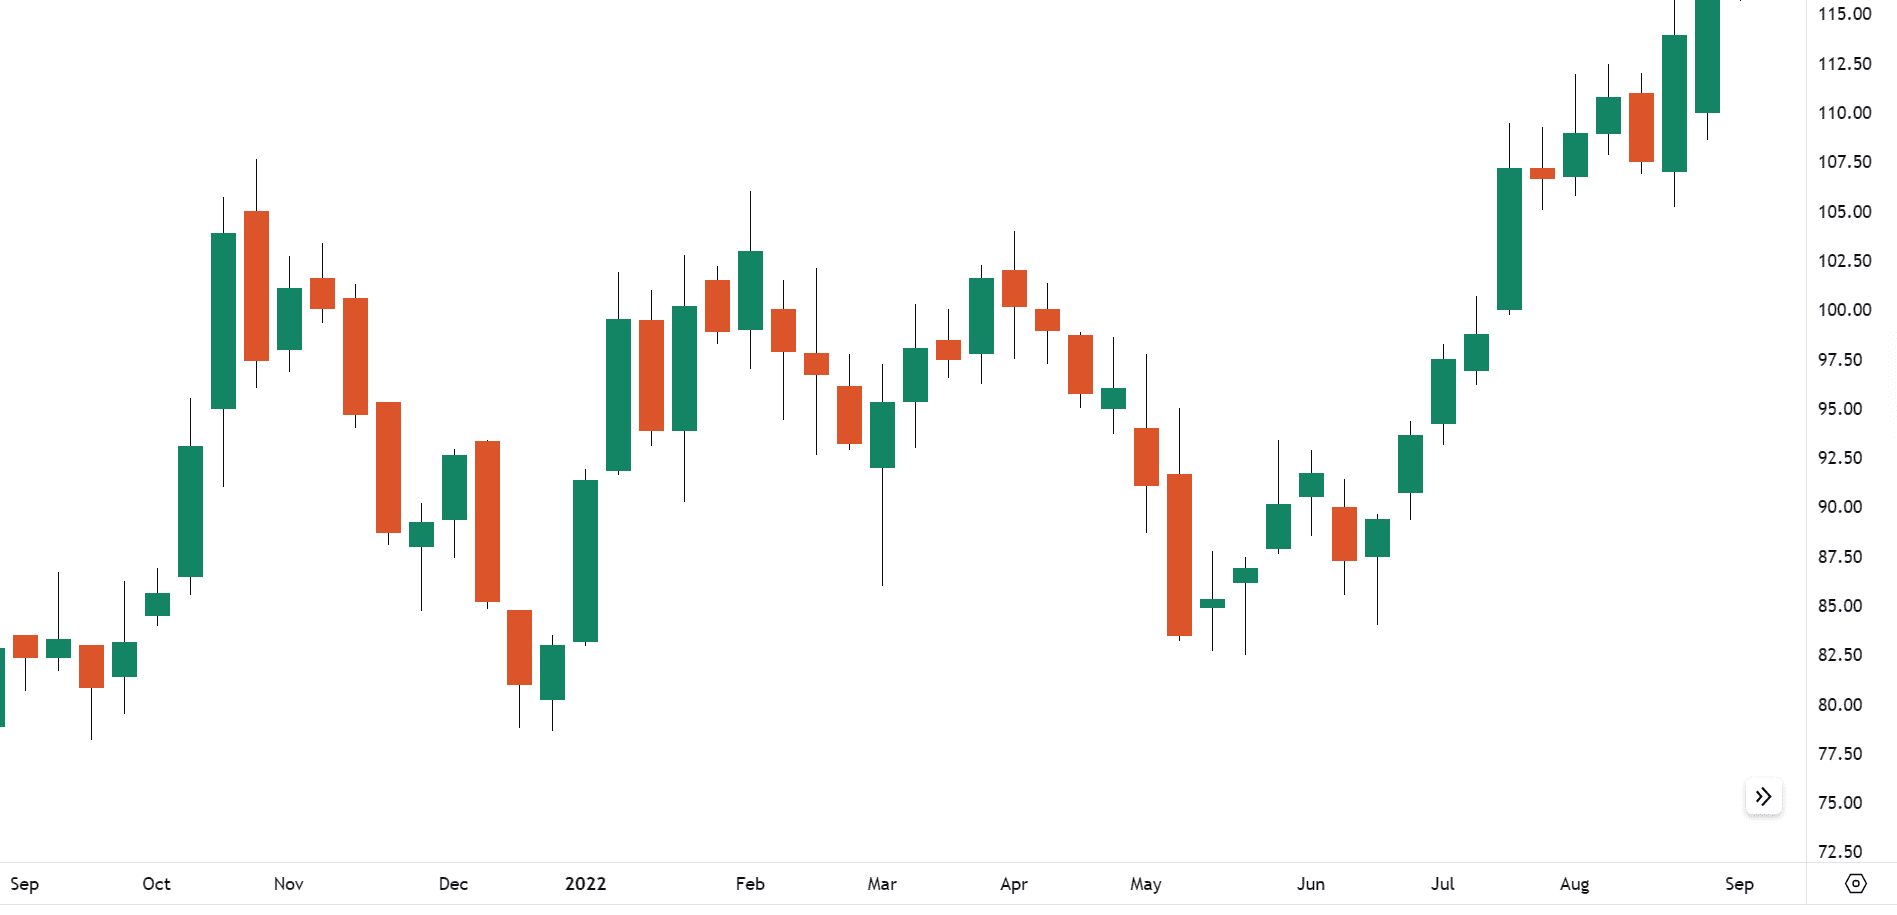
As you can see the above chart, there are several horizontal candles or bars that form this chart. Each candle has three parts: The Body, Upper shadow and Lower shadow. Also, each body is colored either Green or Red. Every candle is a representation of a time period that you select and the data corresponds to the trades executed during that period and shows visually using candlestick.
How to Read Candlestick Charts?
Reading candlestick charts may seem difficult at first, but once you learn it, they can provide valuable information about price movements. Here’s a basic guide to get started:
Let’s look first into the components of candlesticks
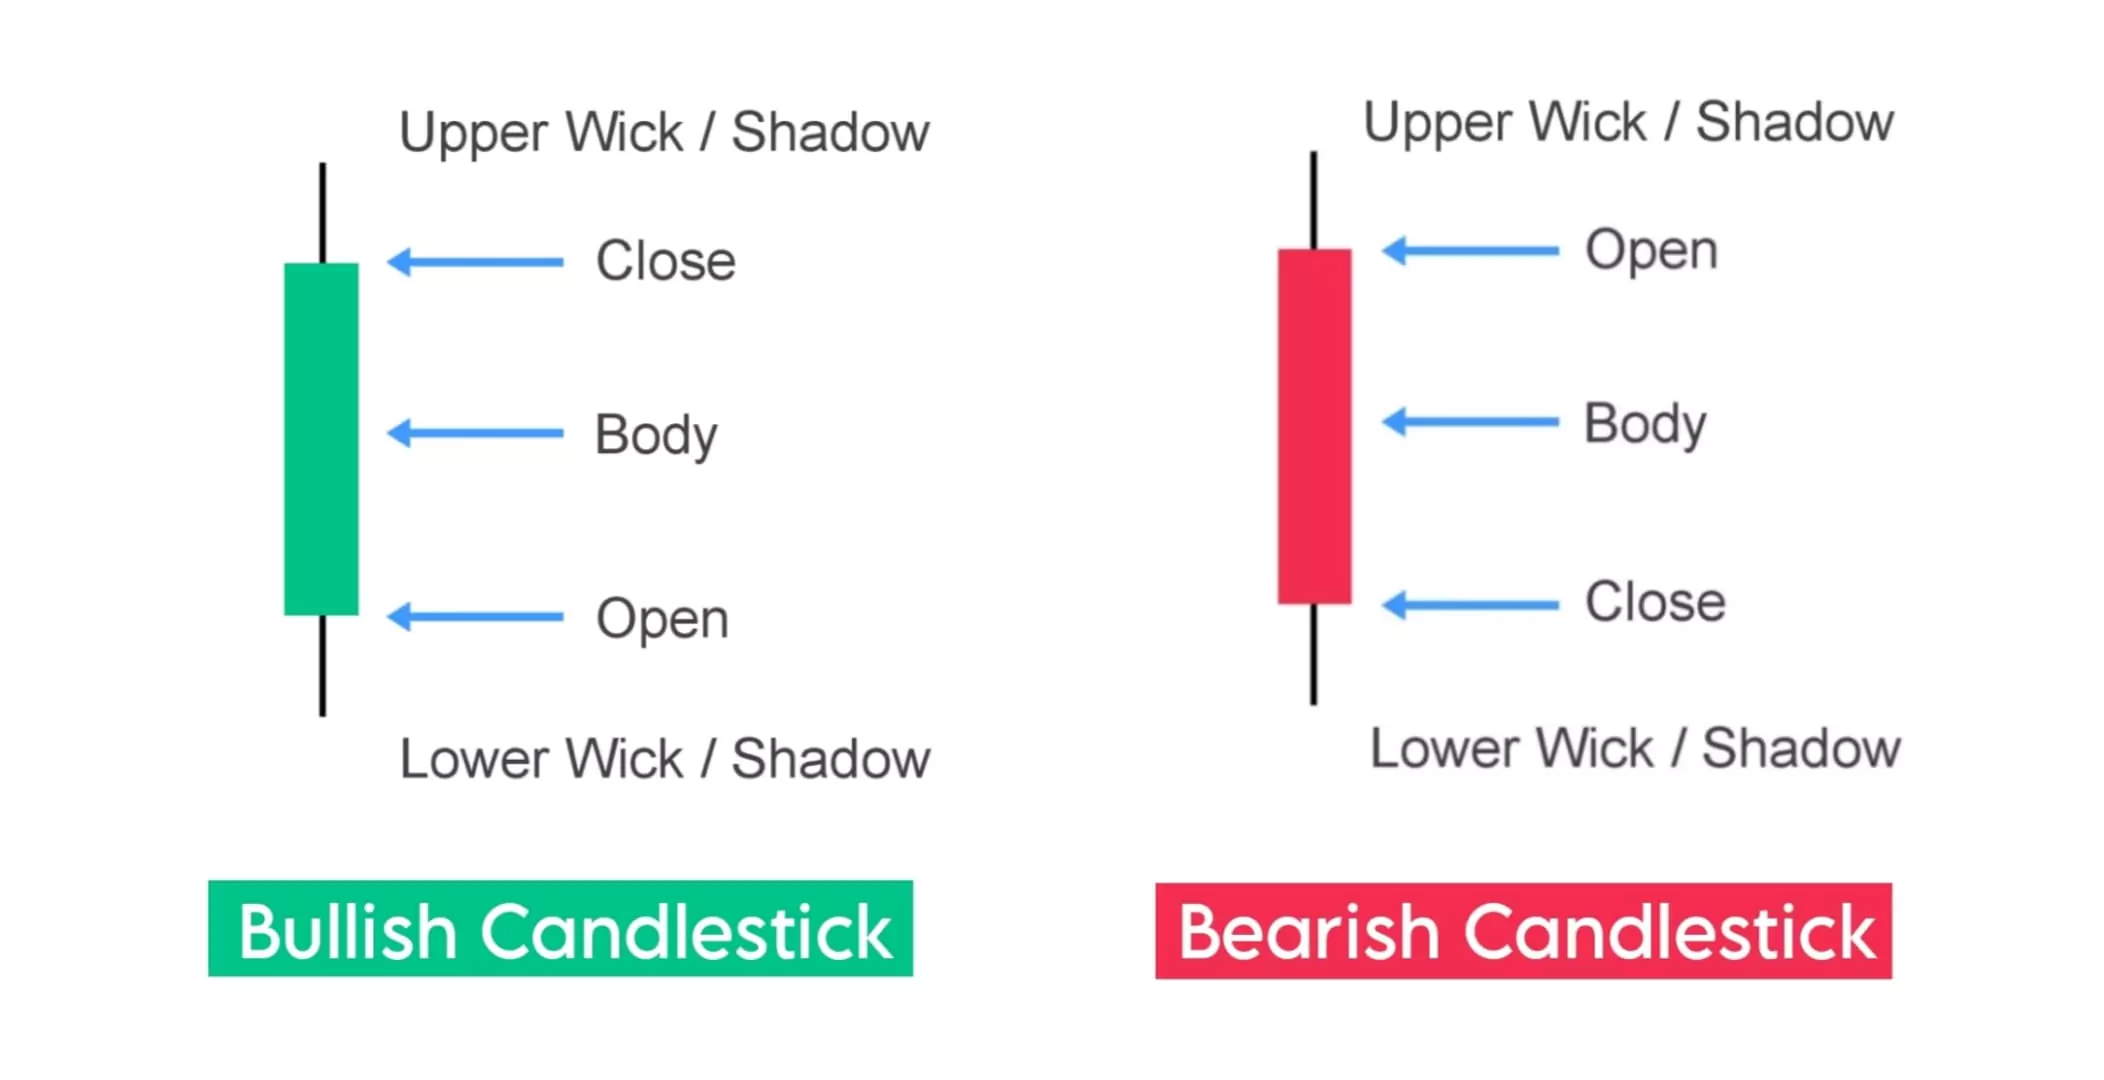
A candle has four points of data for a specific time period:
- Open – the first trade during the period specified by the candle
- High – the highest traded price
- Low – the lowest traded price of a specific time of candle
- Close – the last trade during the period specified by the candle close
Bullish Candle: If the candle’s close is higher than the open – the candlestick’s body is green & shows the buyer’s strength. (Upward Candle)
Bearish Candle: If the open is higher than the close – the candlestick body is red & shows the seller’s strength. (Downward Candle)
The Candlestick Body: The area between the opening and closing values is called the candlestick body.
The body of a candlestick pattern represents the price range between the opening and closing within a specific time frame. The body is filled by color (green or red) depending on whether the closing price is higher or lower than the opening price (Bullish or Bearish).
Strength is represented in the form of a bullish/green candle and weakness by a bearish/red candle.
Weak or Shadow: The upper shadow shows the high price, and the lower shadow shows the low prices reached during the trading session.
Note: By changing the time frame on a chart, the candlesticks will also change accordingly.
40 Types of Candlestick Patterns
The candlestick patterns can be divided into three parts:
- Bullish Reversal Patterns
- Bearish Reversal Patterns
- Continuation Patterns
Below is the list of 40+ Types of Candlestick Patterns which are categorised into the above-mentioned categories:
Bullish Reversal Candlestick Patterns
Bullish candlestick patterns indicate a higher possibility of upward price movement. It typically suggests that buyers are in control the market and The buyer’s closing price is higher than the opening price. Bullish patterns shows larger green bodies and long lower wick, and short or no upper wick.
So, when you see a bullish candle pattern, it’s like the market saying, “Hey, the downtrend might be over, and an uptrend could be starting.”
Below are the different types of bullish reversal patterns:
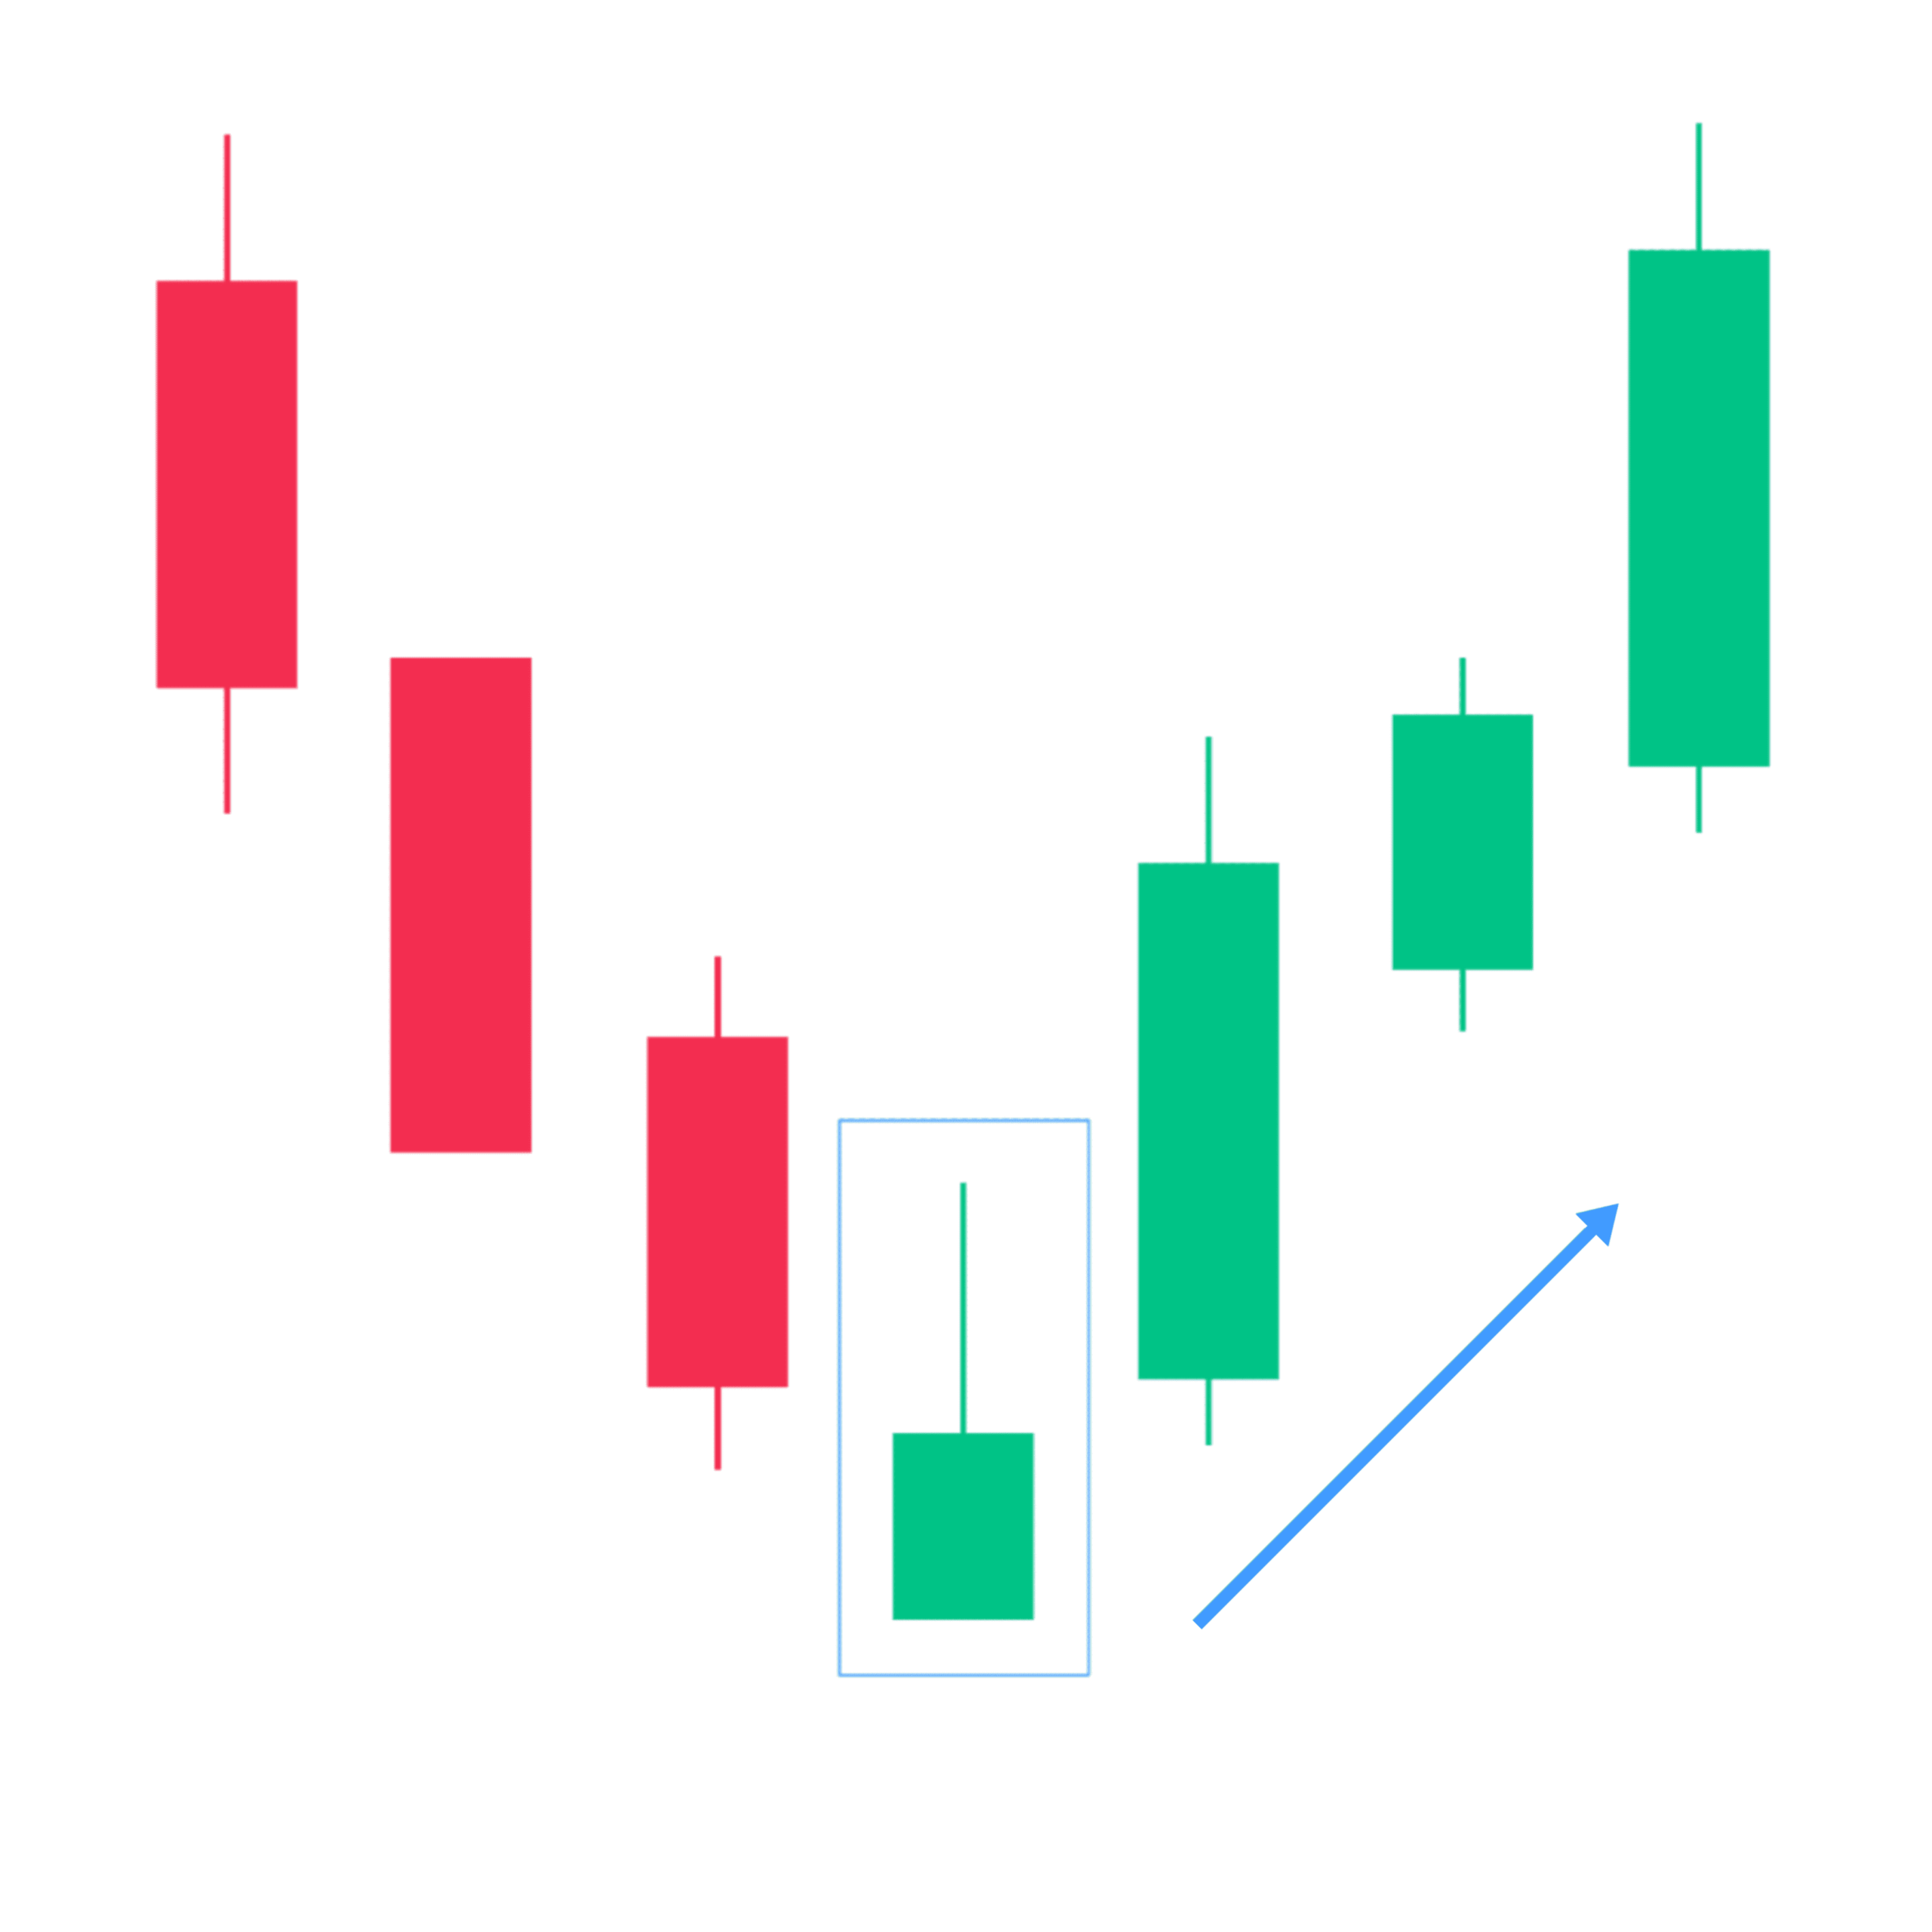
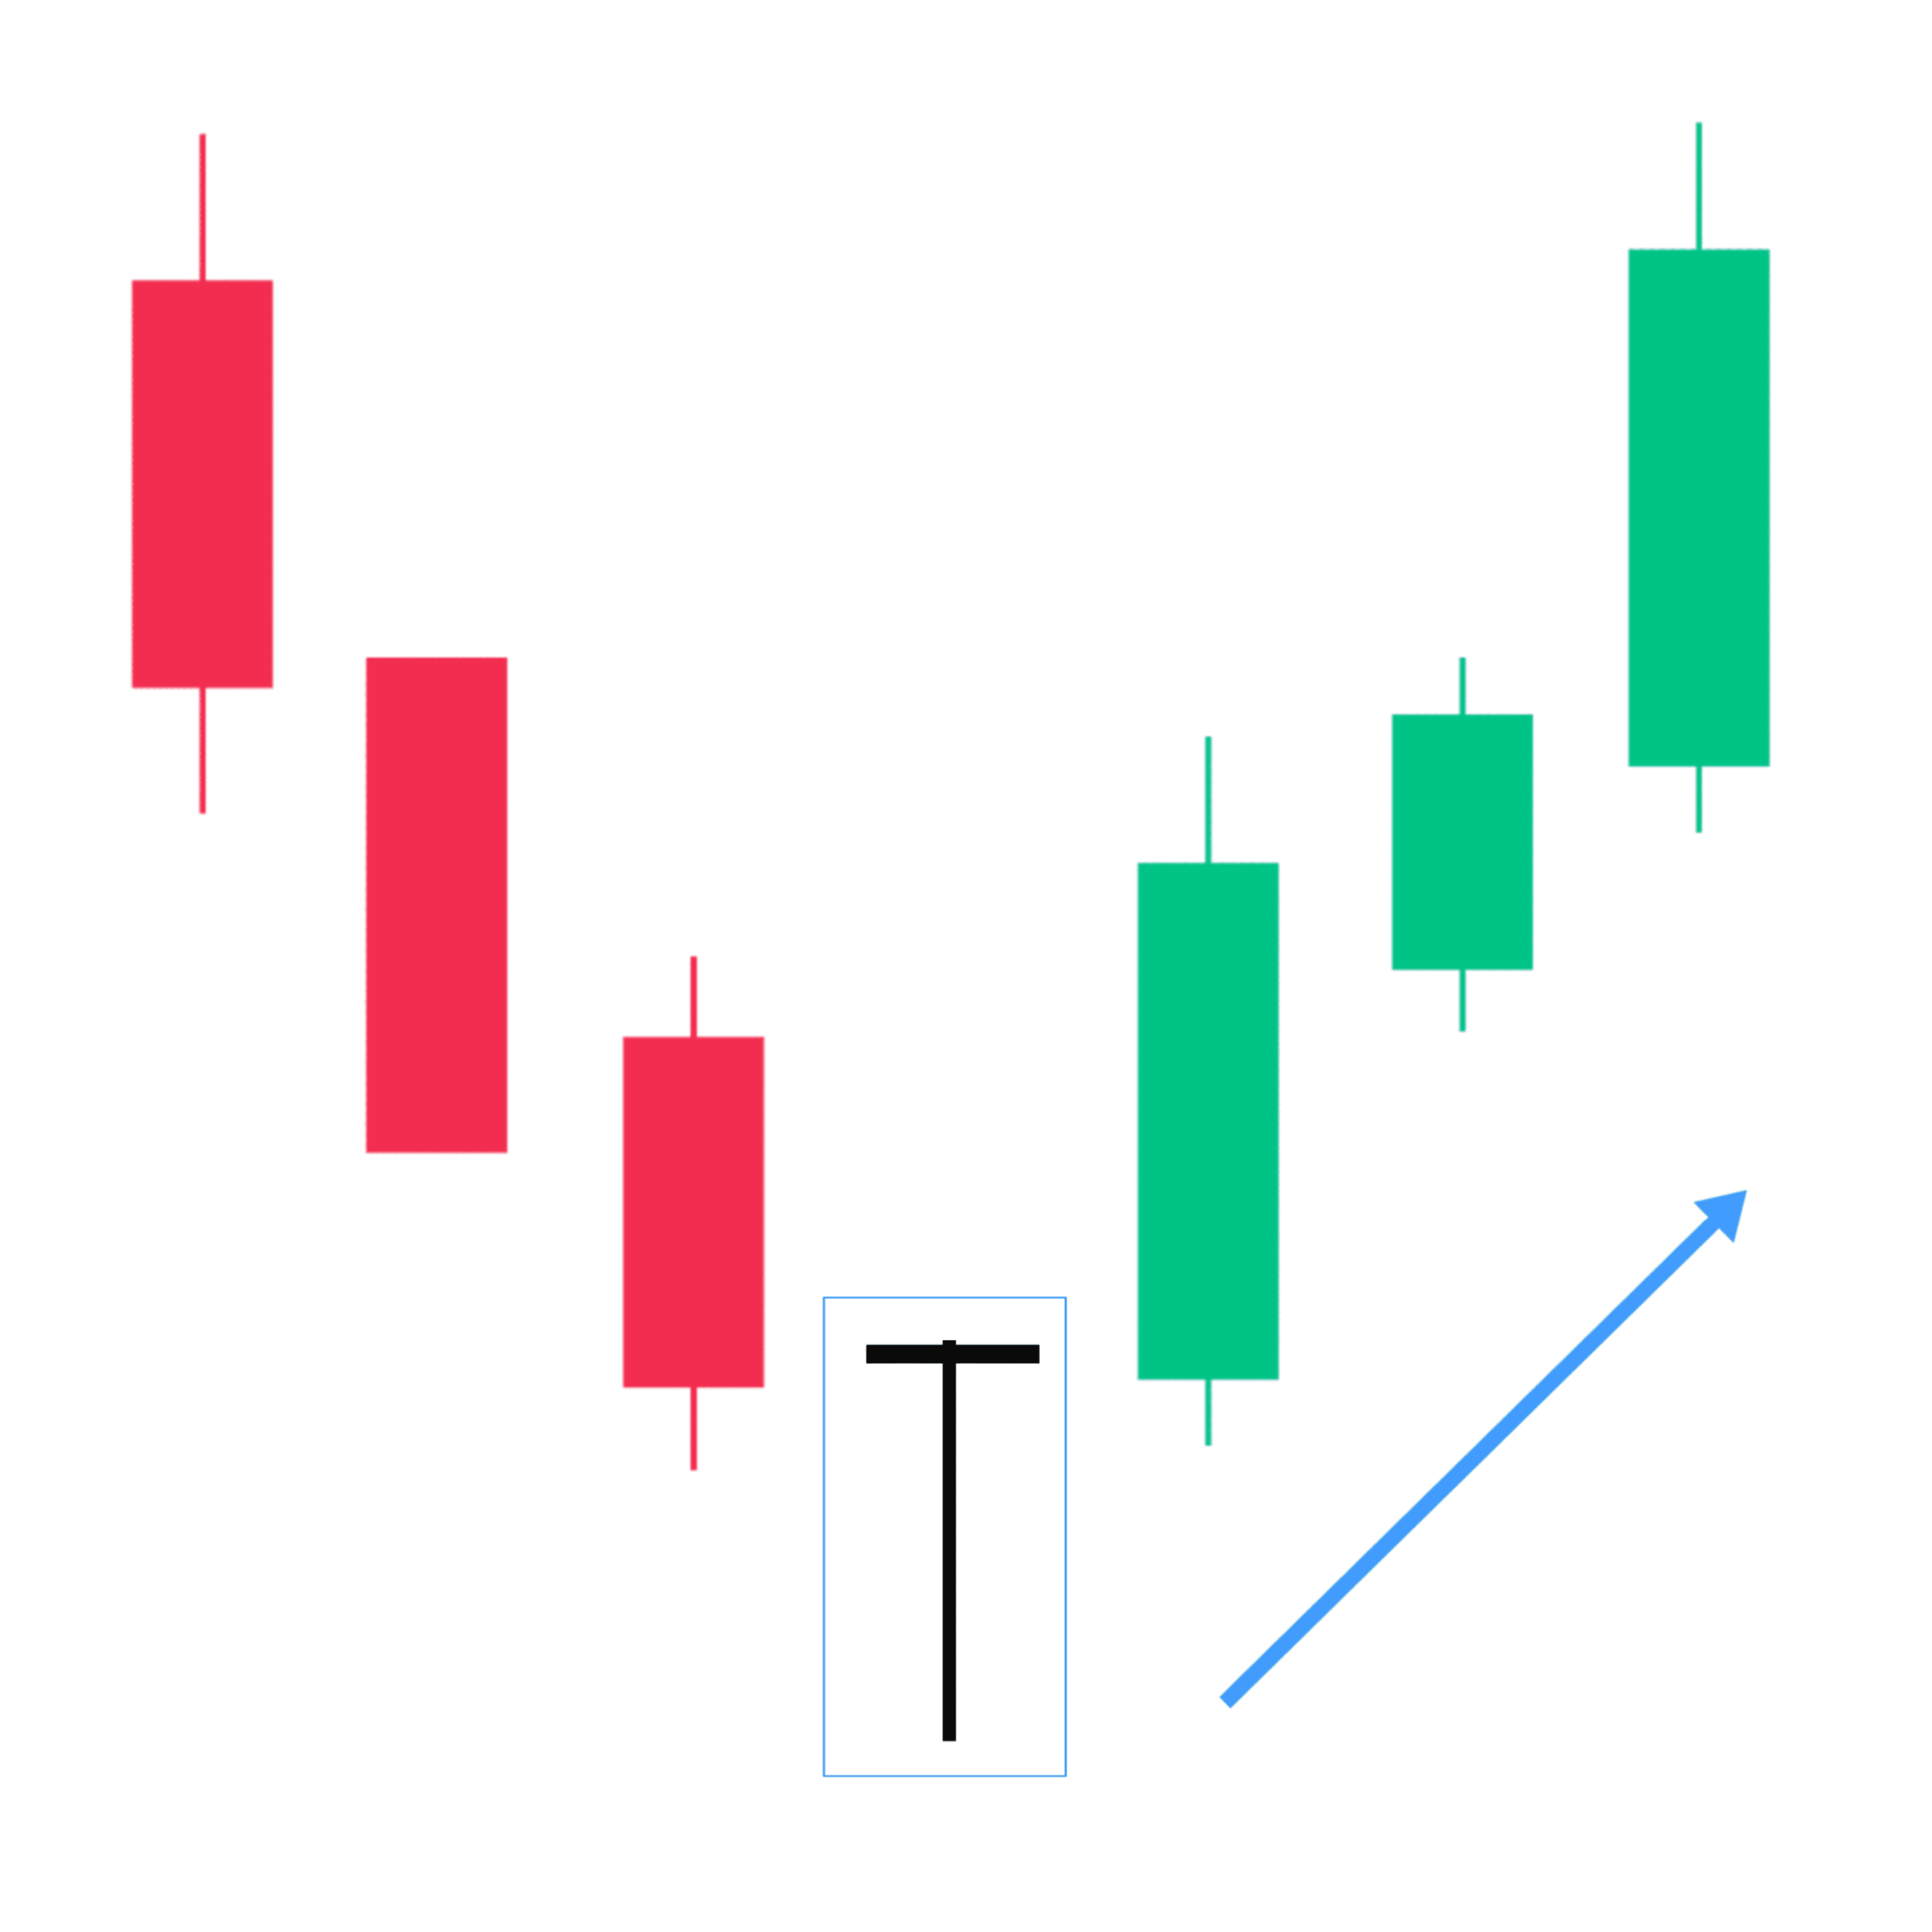
1. Hammer
A hammer Candlestick is a bullish single Candlestick Pattern, Most traders use hammer candlesticks in their trading as a strategy to identify potential buying opportunities, The hammer is treated as a bullish reversal, but only when it appears under certain conditions.
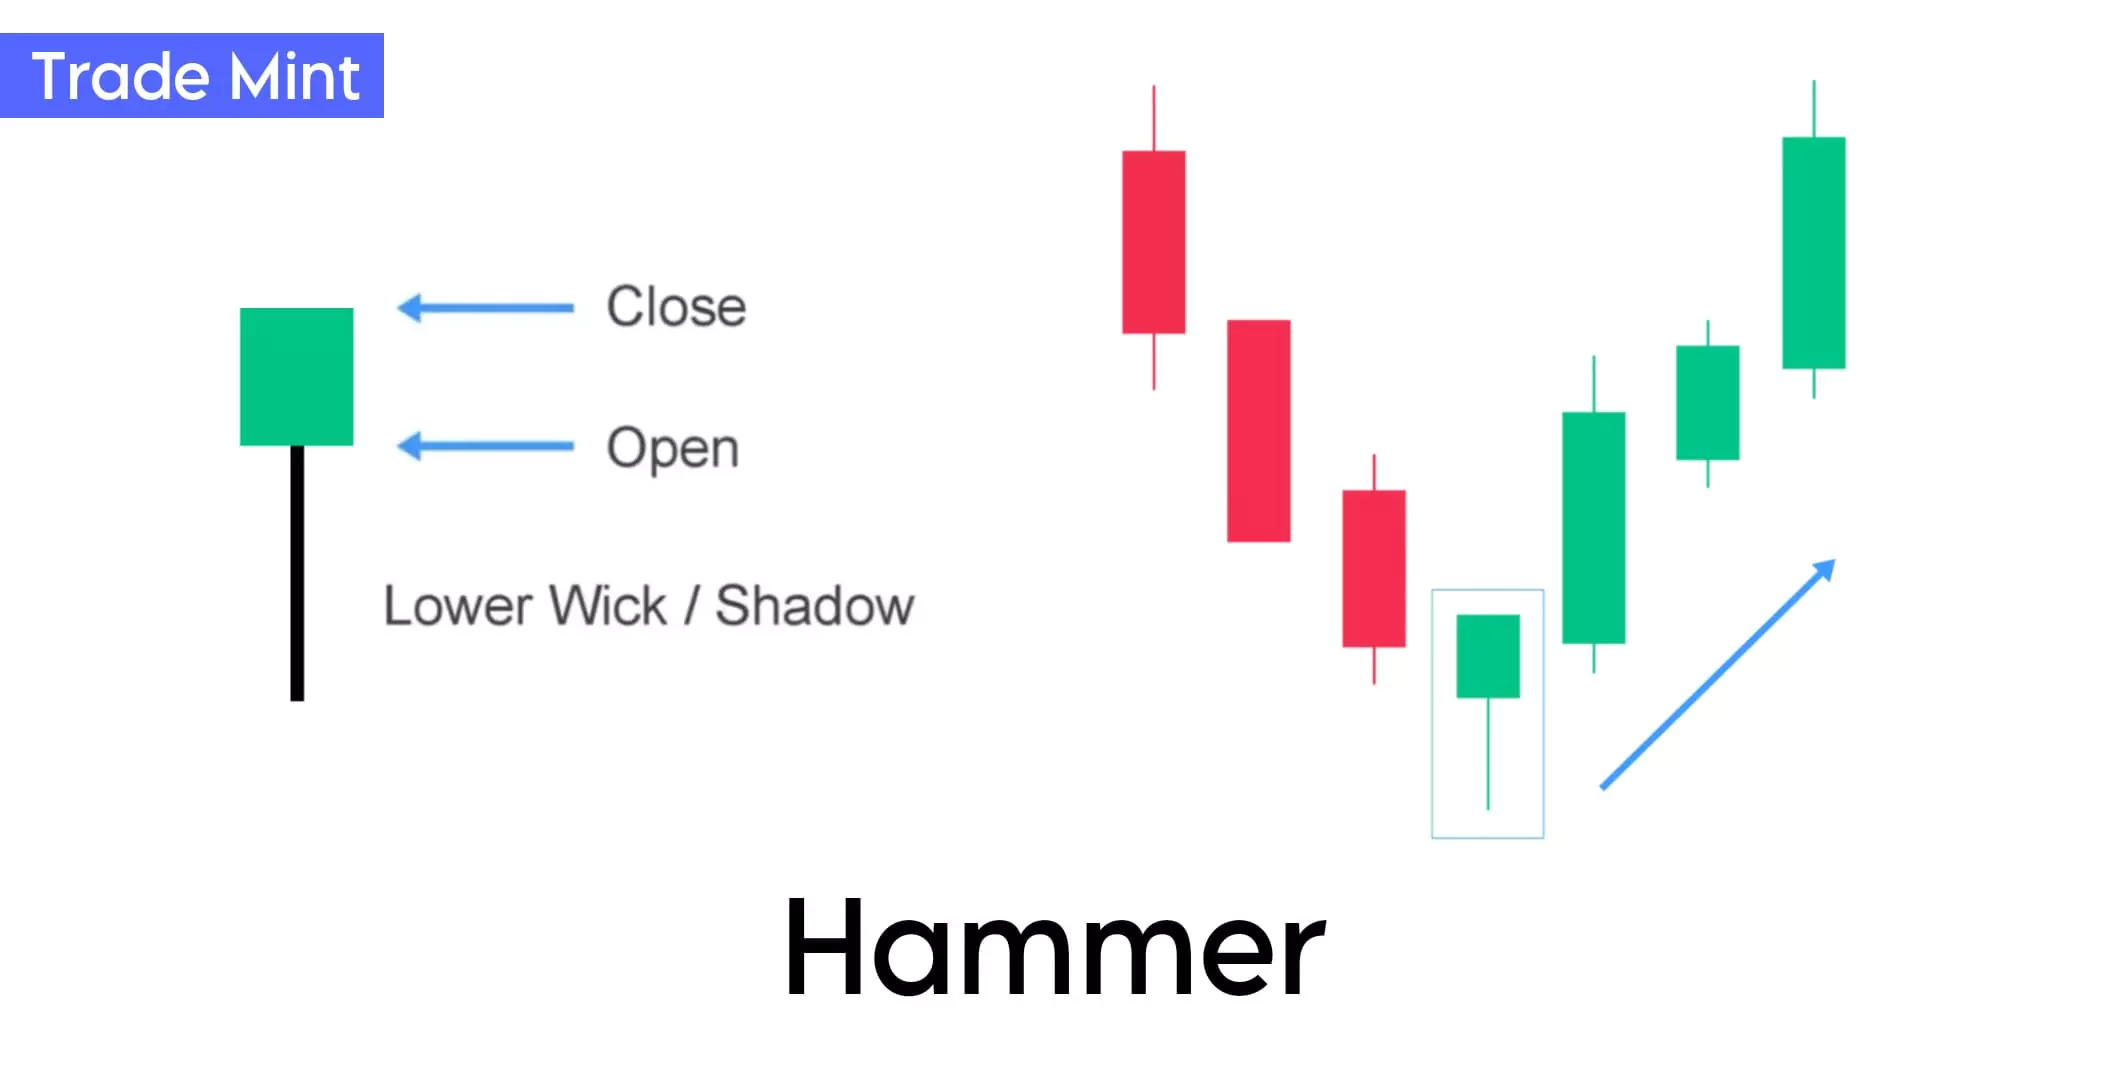
“A hammer candlestick pattern is a bullish reversal pattern, It forms as a single candlestick after a downtrend in the chart. A hammer has a lower shadow which is twice as long as the real body. with almost no upper wick.”
The hammer candlestick is found at the bottom of a downtrend and signals a potential (bullish) reversal/retracement in the market.
The lower wick or shadow of the candle is at least twice the size of a short body with little or no upper shadow. So the small body indicates that buyers maintained control and prevented further selling pressure.
Guide: Traders should enter long positions only after the confirmation of the second candle closing above the hammer candle. Now a stop-loss can be placed at the low of the hammer’s shadow.
How to identify Hammer: Below is an example of a hammer pattern
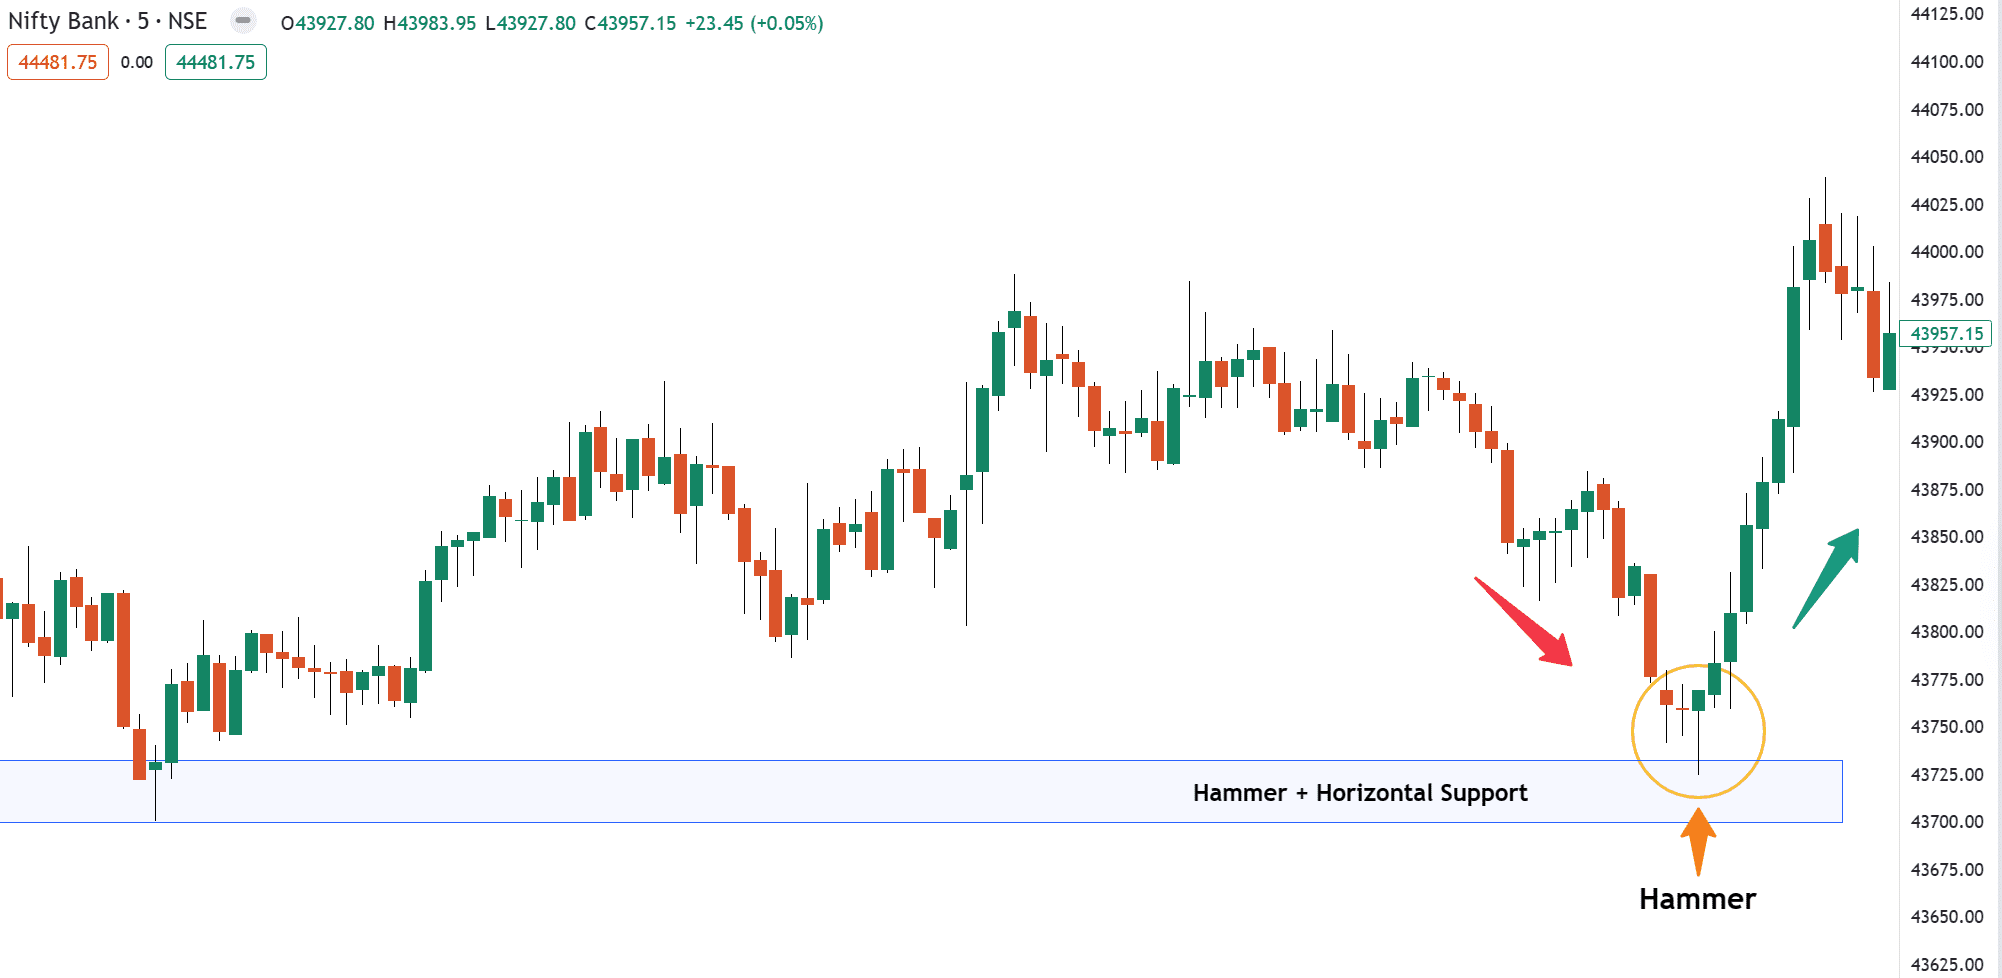
To get a clear idea about the Hammer Candlestick pattern and how it looks like, please Refer the Images in this section with practical knowledge
2. Inverted Hammer
The inverted hammer is a bullish candlestick pattern found after a downtrend and is usually considered a trend-reversal signal.

“The inverted hammer is a bullish candlestick pattern found after a downtrend and is usually considered a trend-reversal signal, This contains a small body at the bottom and a long higher shadow at the top.”
An inverted hammer is a single candle pattern, This pattern shows sellers pushed prices back to where they were at the open, but increasing prices show that bulls are testing the power of the bears in this trading session.
Guide: Traders create a long position after they spot a formation. Confirmation may occur on the second bullish candlestick when breaks and closes above the wick of previous candle.
Stop-loss must be set lower of the candle to ensure that you do not lose too much funds while using this pattern.
Note: This candlestick pattern is similar to its inverse counterpart of the shooting star candlestick pattern. These two are not to be mistaken for one other.
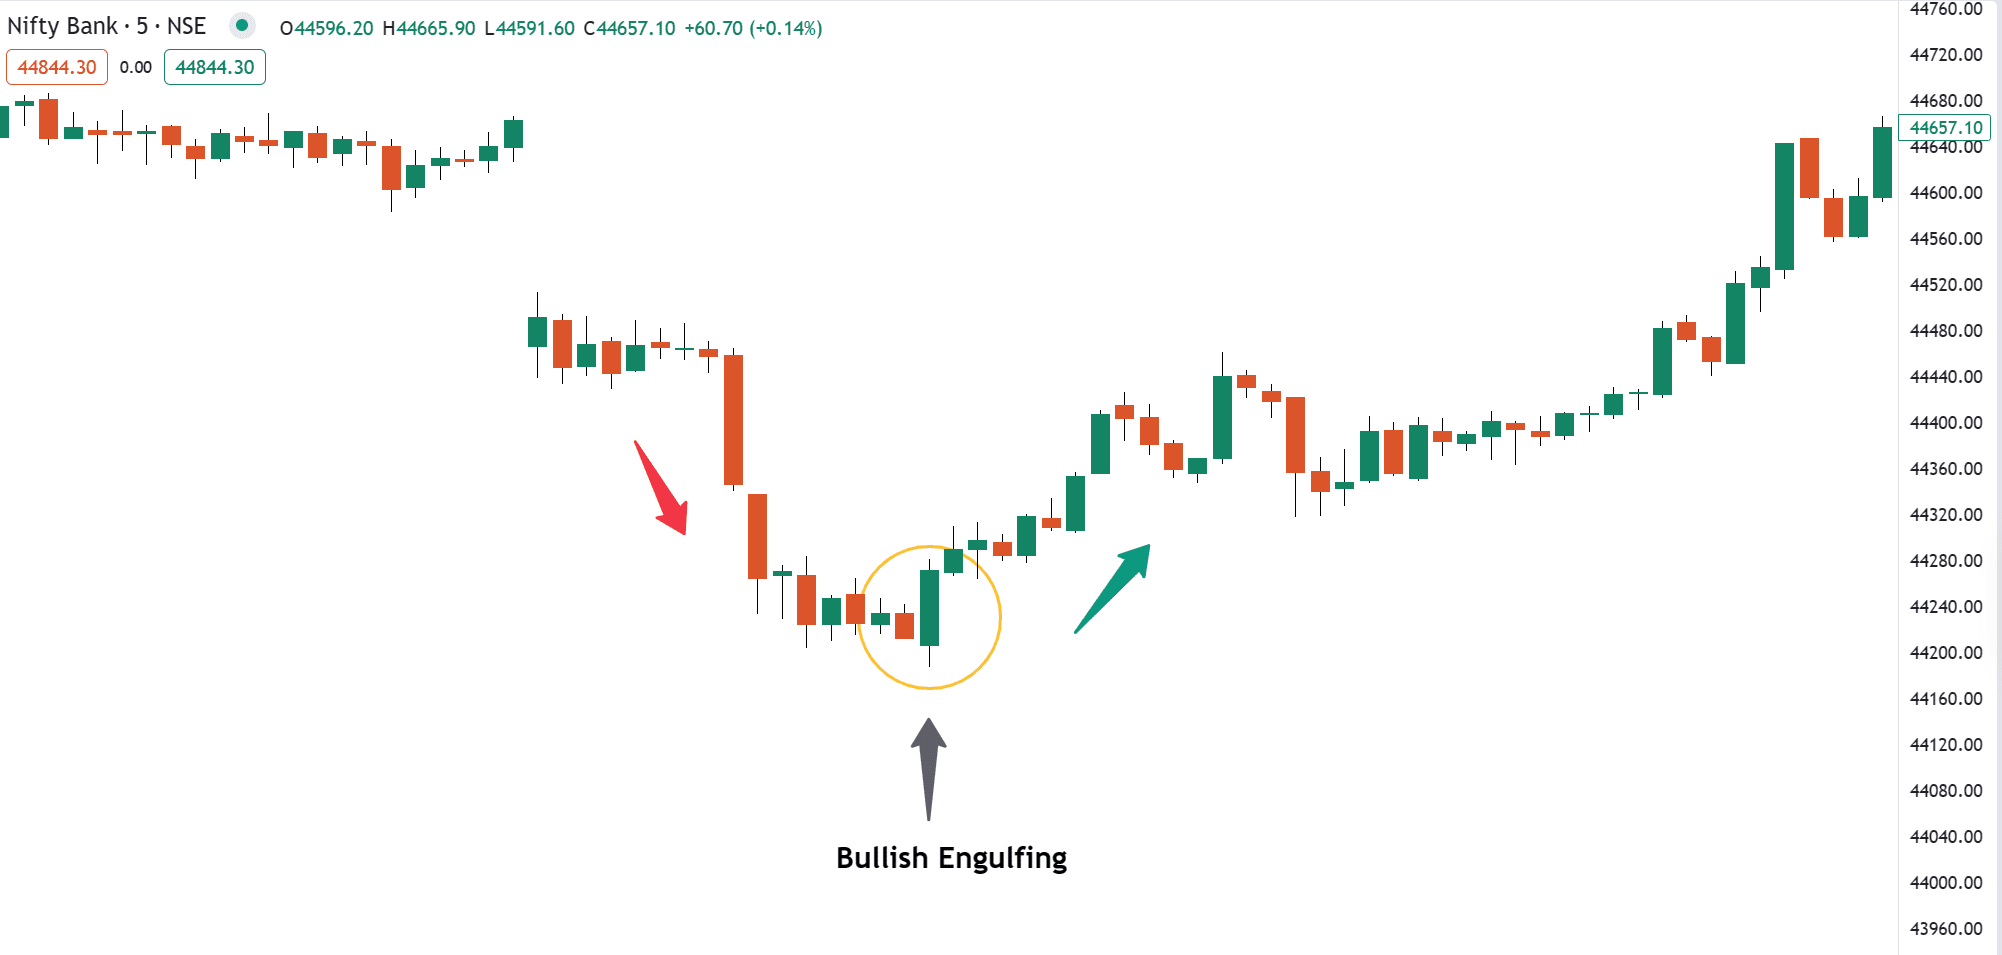
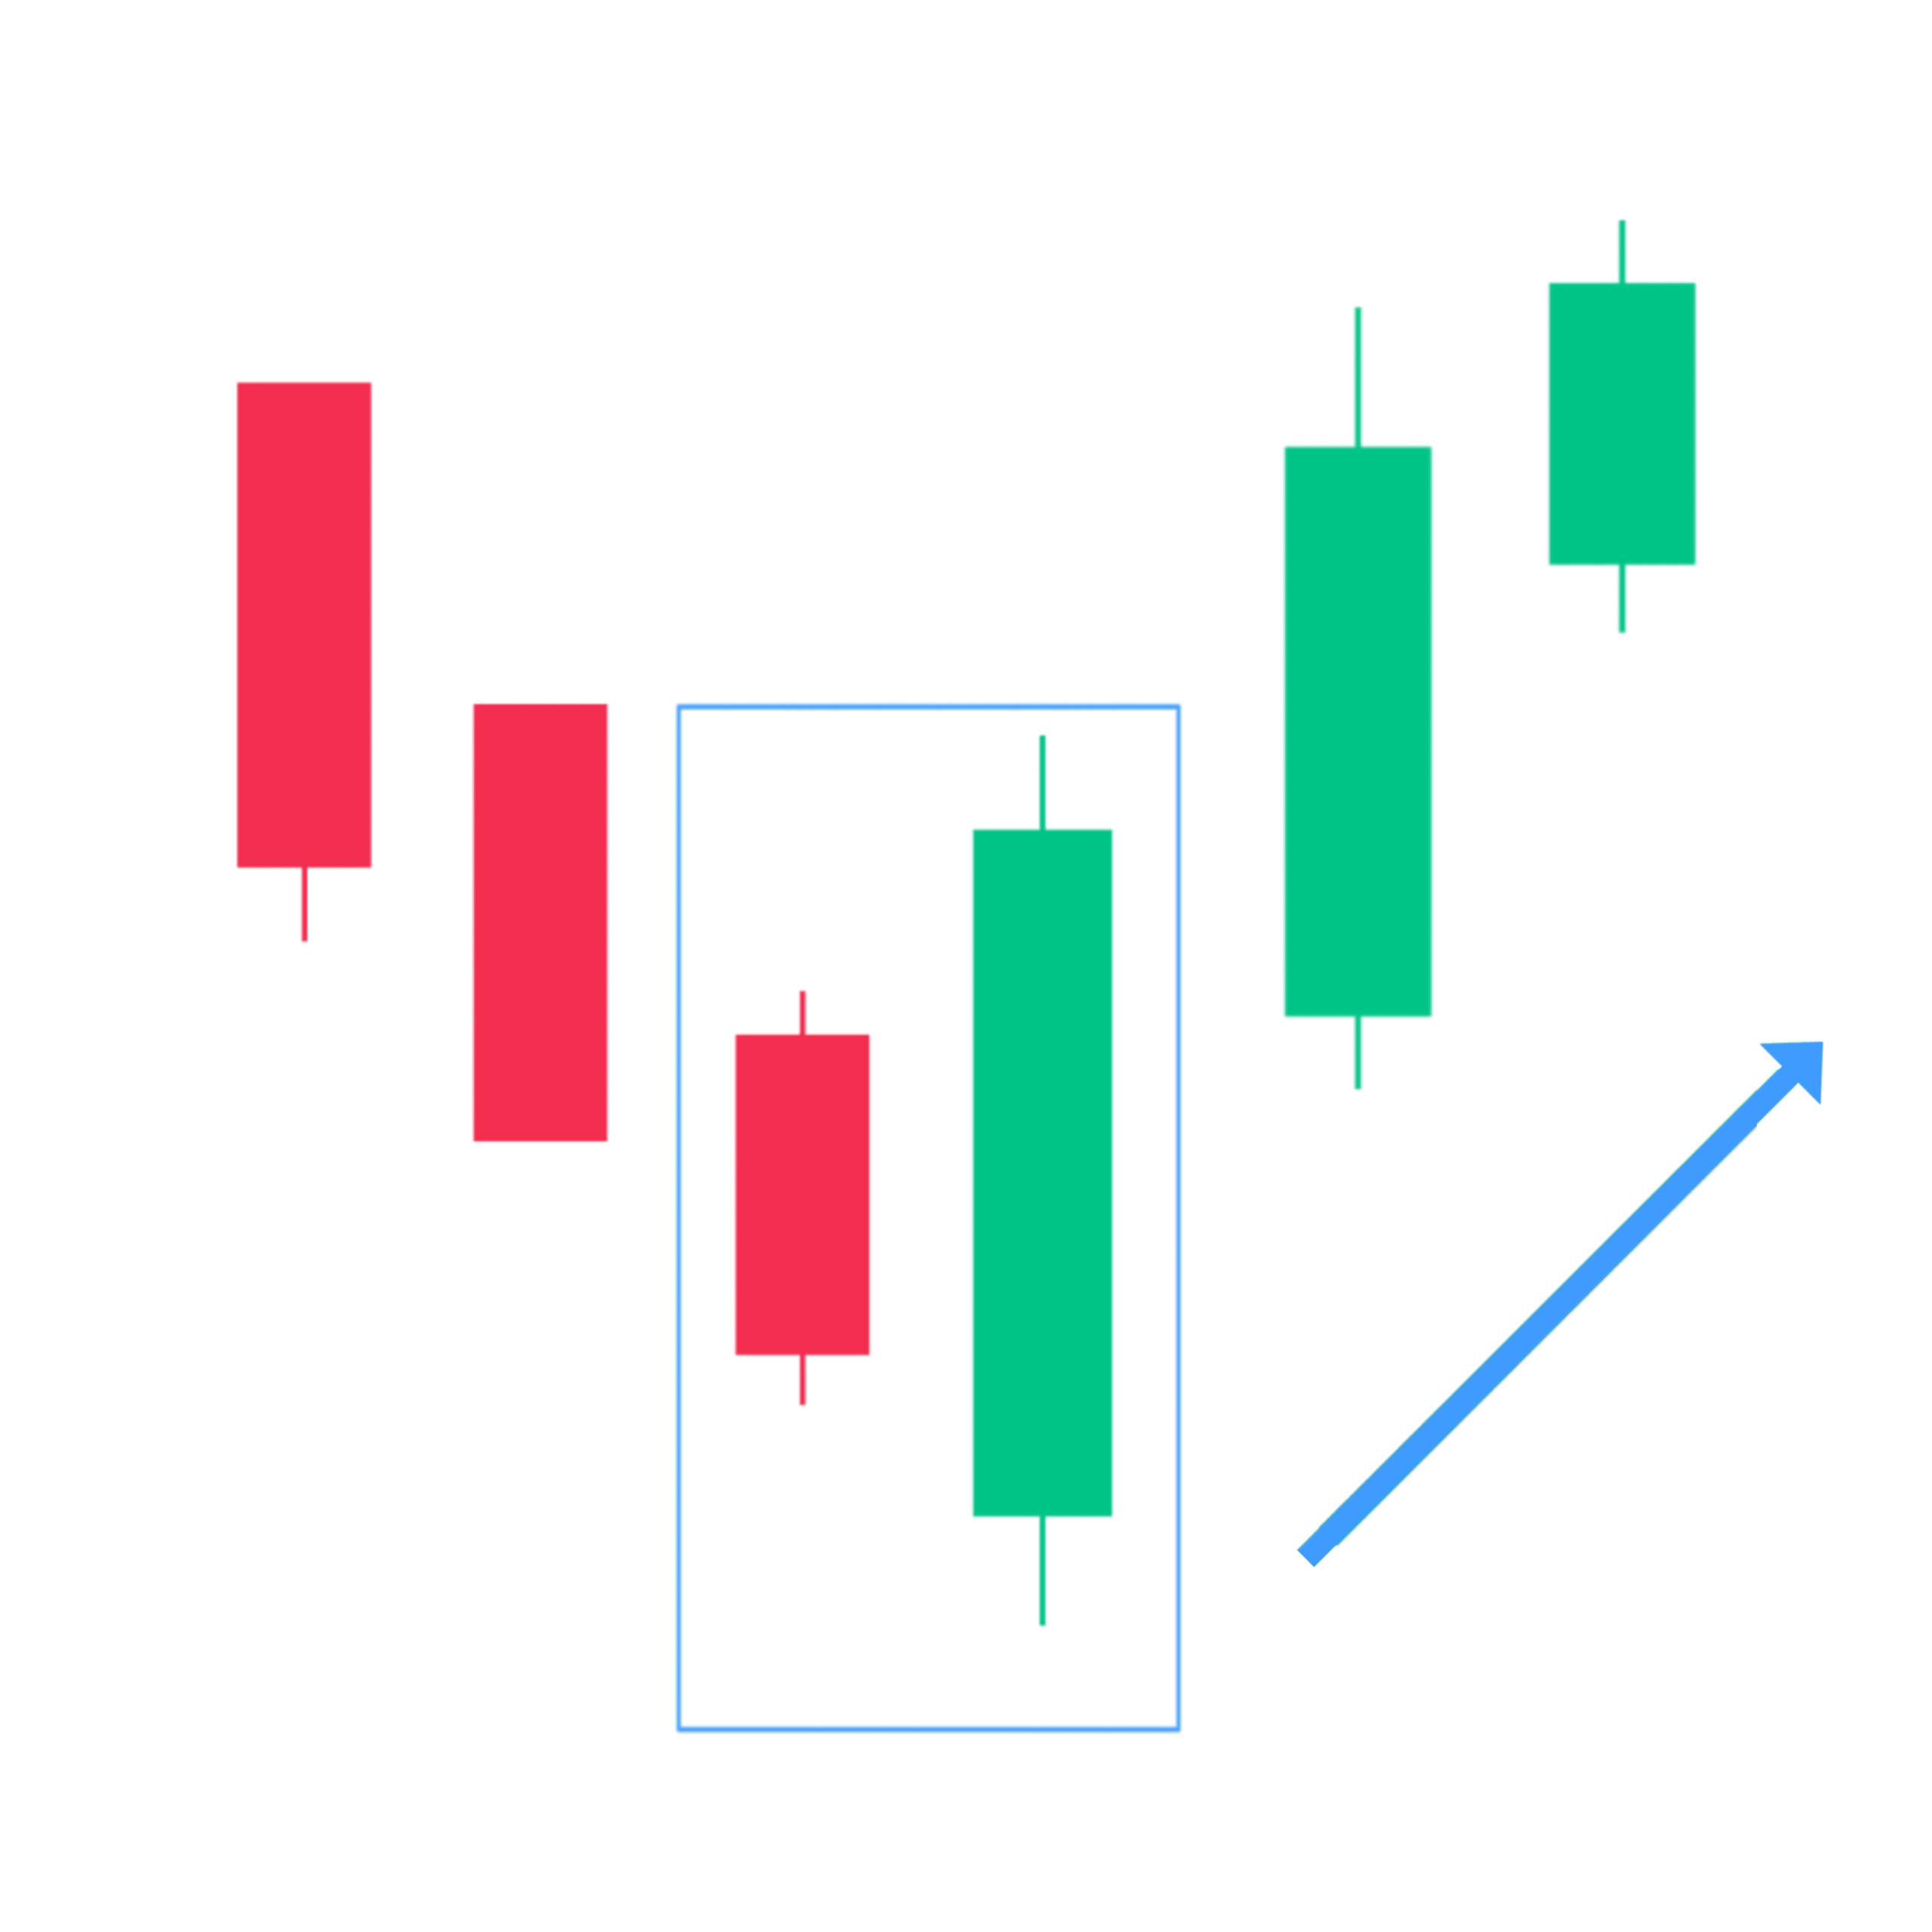
3. Bullish Engulfing
The engulfing candlestick pattern is one of the most common patterns used by traders to identify trend reversals and continuations after a pullback/retracement in the markets.

“The bullish engulfing candlestick pattern consists of two candles, where the second bullish candle’s body completely ‘engulfs’ the first bearish/red candle’s body. It is formed after a downtrend in the chart.”
The first candle is a bearish candle that indicates the continuation of the downtrend.
The second candle is a long bullish candle that completely engulfs or overlaps the first candle and shows that the bulls are back into the market .
This pattern suggests that sellers may be losing momentum and buyers are starting to take control.
Guide: Traders should enter long positions only after the confirmation of the second candle closing above the previous candle, The stop loss can be placed below the recent swing low – which is the low of the Second Candle.
Below is an example of Bullish Engulfing pattern:
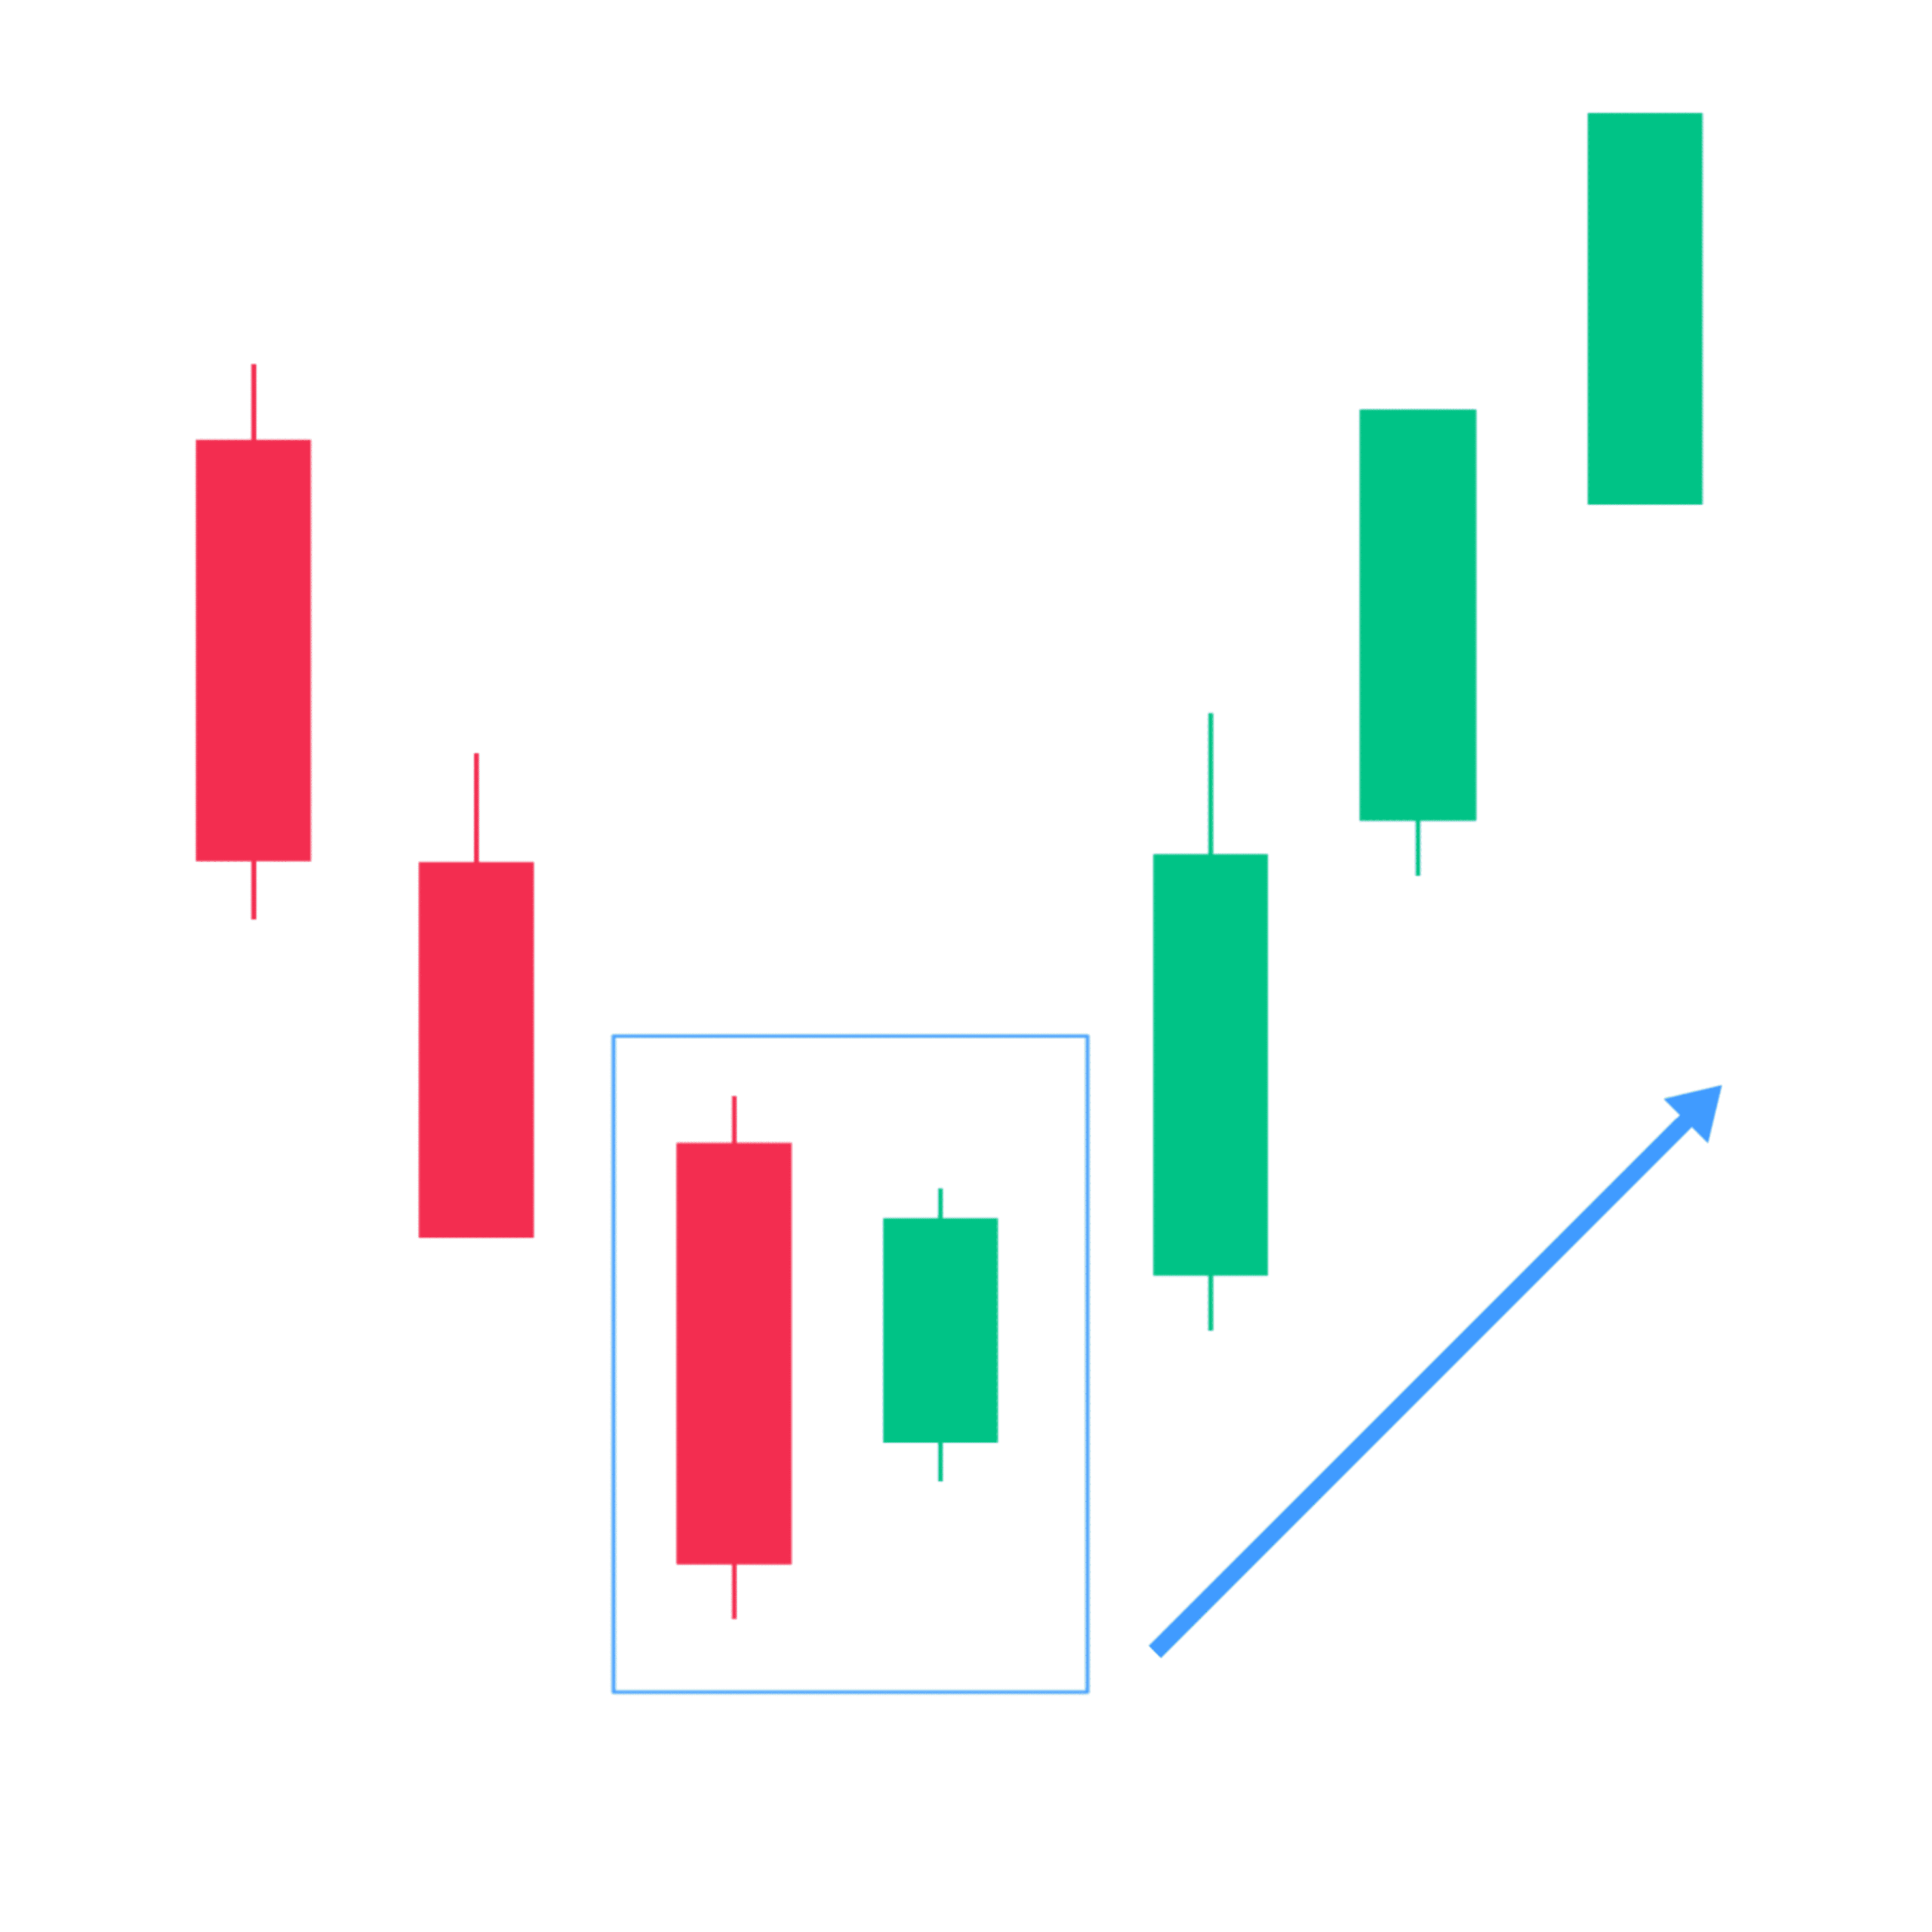
4. Bullish Harami
The word ‘Harami’ is a Japanese term, that means ‘pregnant’. The combination of candlesticks where the first candle is ‘pregnant’ with the second smaller candle is a baby candle just you can see the diagram its looks like a pregnant.
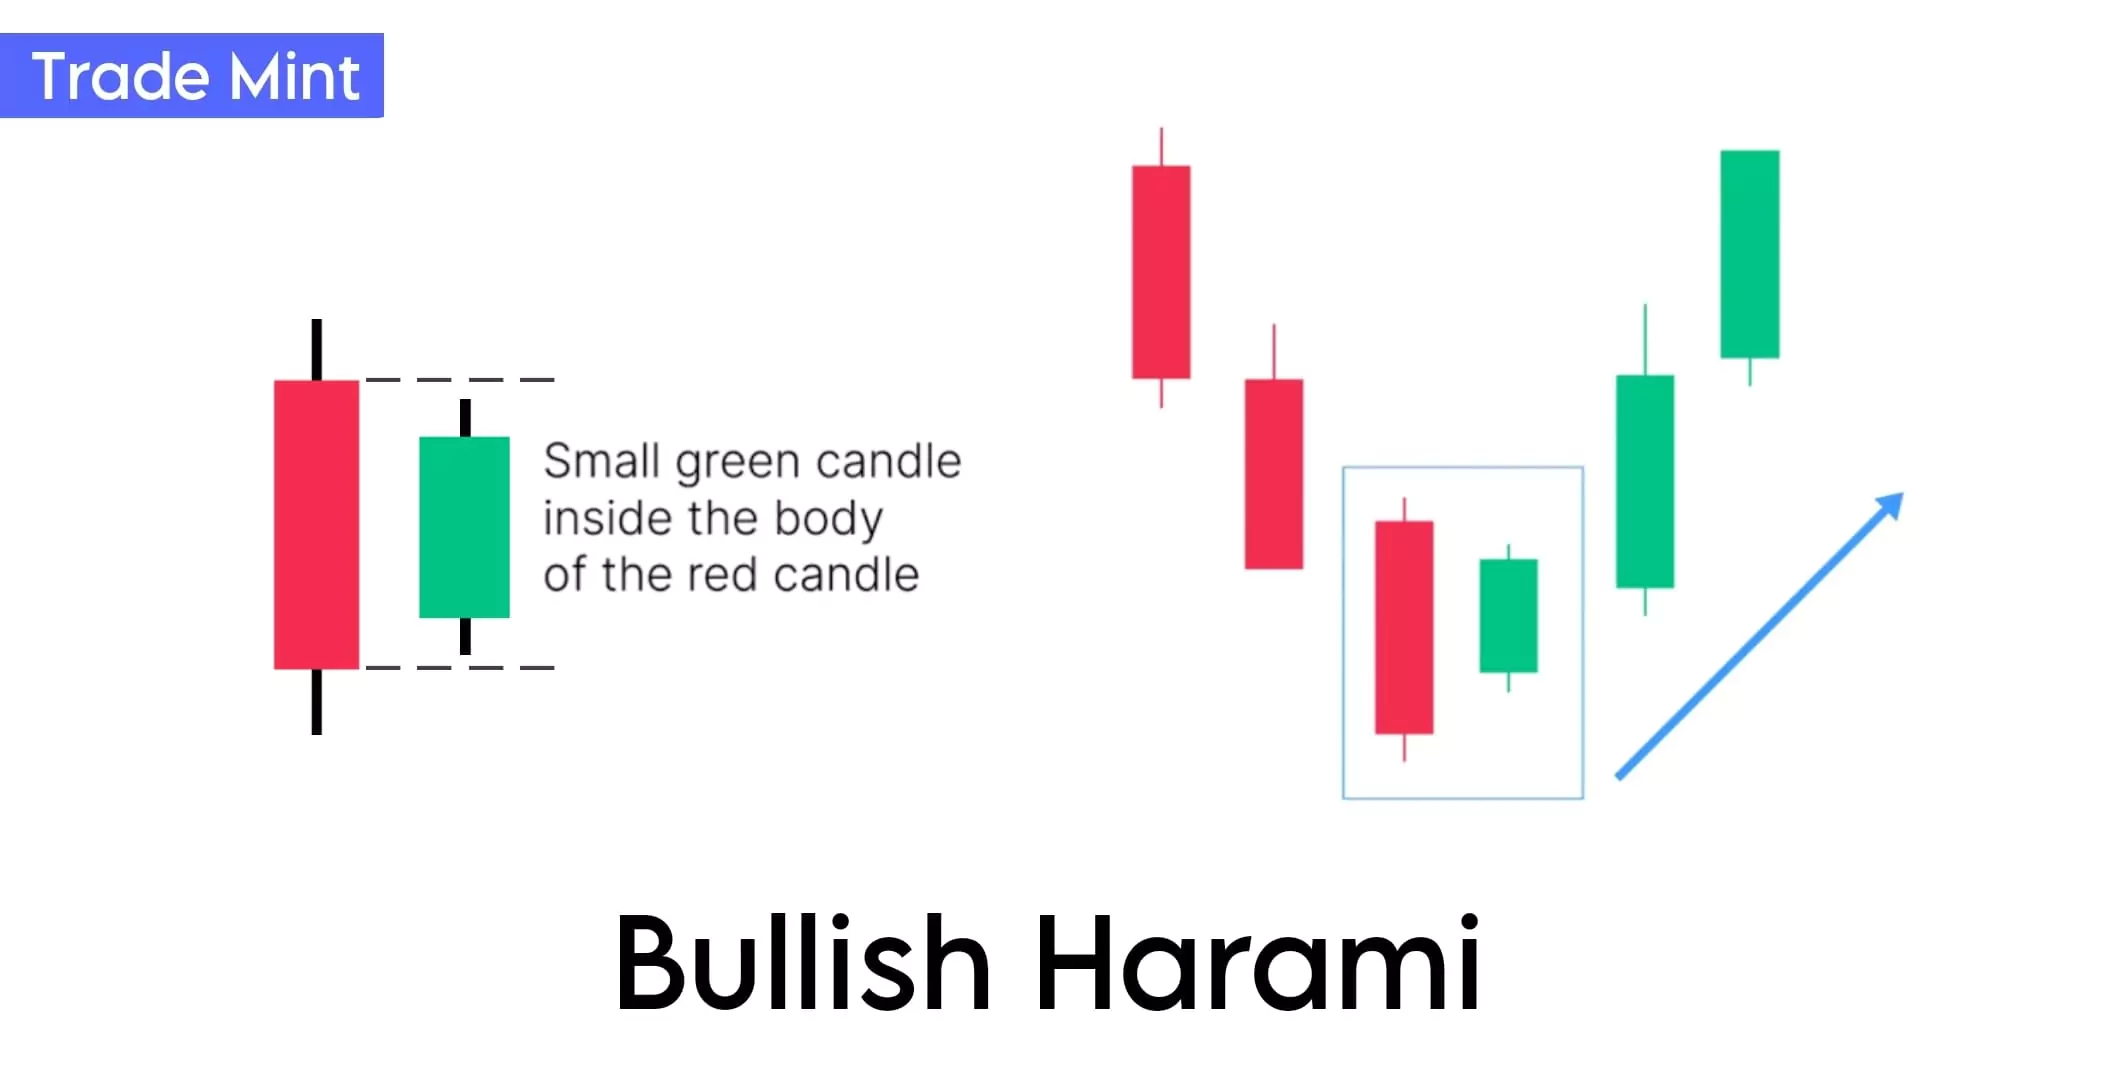
“The bullish harami is a two-candle pattern that signals a potential reversal in a downtrend. The first candle is usually strong selling candle, and the second candle has a small body that is completely inside the range of the previous candle. A Harami candlestick is also known as inside candle or a baby candle.“
After the completion of this candlestick pattern, traders can take a long position.
Guide: Traders enter a long position as soon as they spot a formation. However, it’s important to wait for confirmation before entering the trade so you don’t trap. Confirmation may come as the next bullish candlestick after the formation and place the stop loss below the lowest level of the first bearish candlestick.
Note: The Harami candlestick pattern and the Three Inside Up pattern are different, both have different entry points.
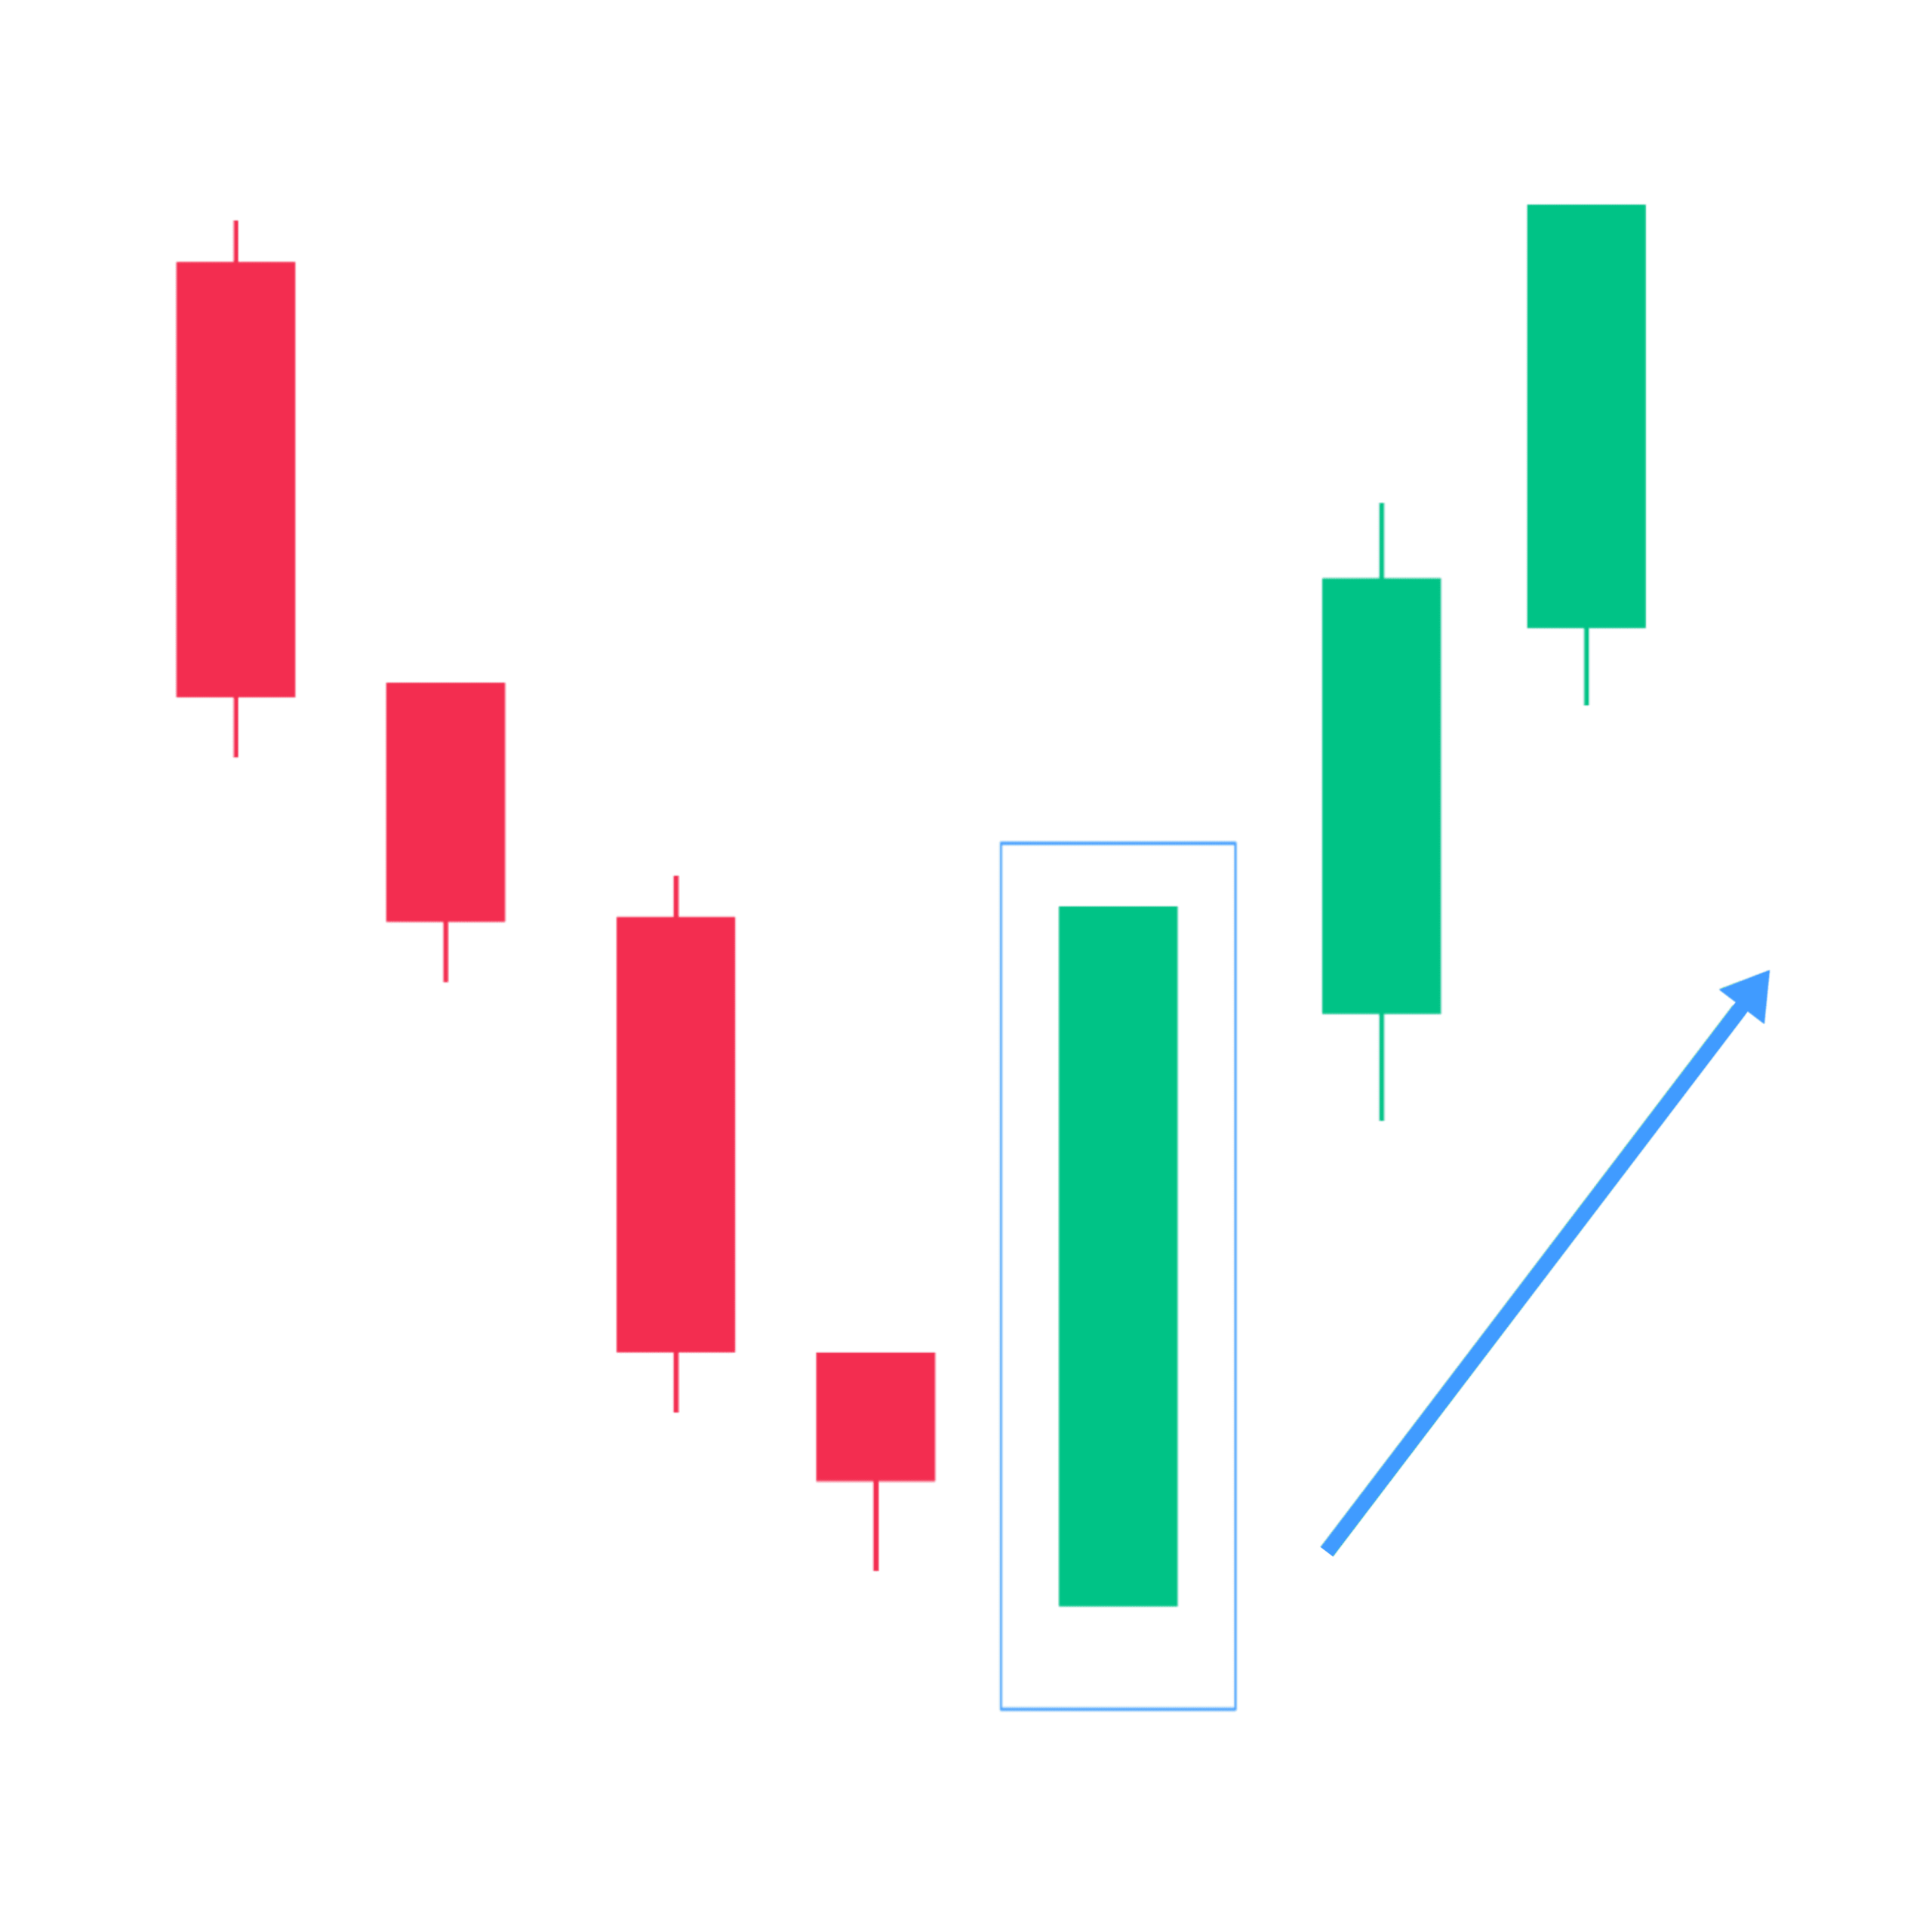
5. Bullish Marubozu
The Bullish Marubozu is a single candlestick pattern that is formed after a downtrend and indicates a potential bullish reversal.

“A bullish Marubozu is a long green candlestick with no upper or lower wick. This candle indicates that buyers controlled the market price from the open to the close, suggesting a strong bullish reversal or bullish sentiments in the market.”
A Bullish Marubozu forms when “Open equals low, and close equals high”. This indicates that buyers controlled the price action from the first to the last trade and created a strong candle.
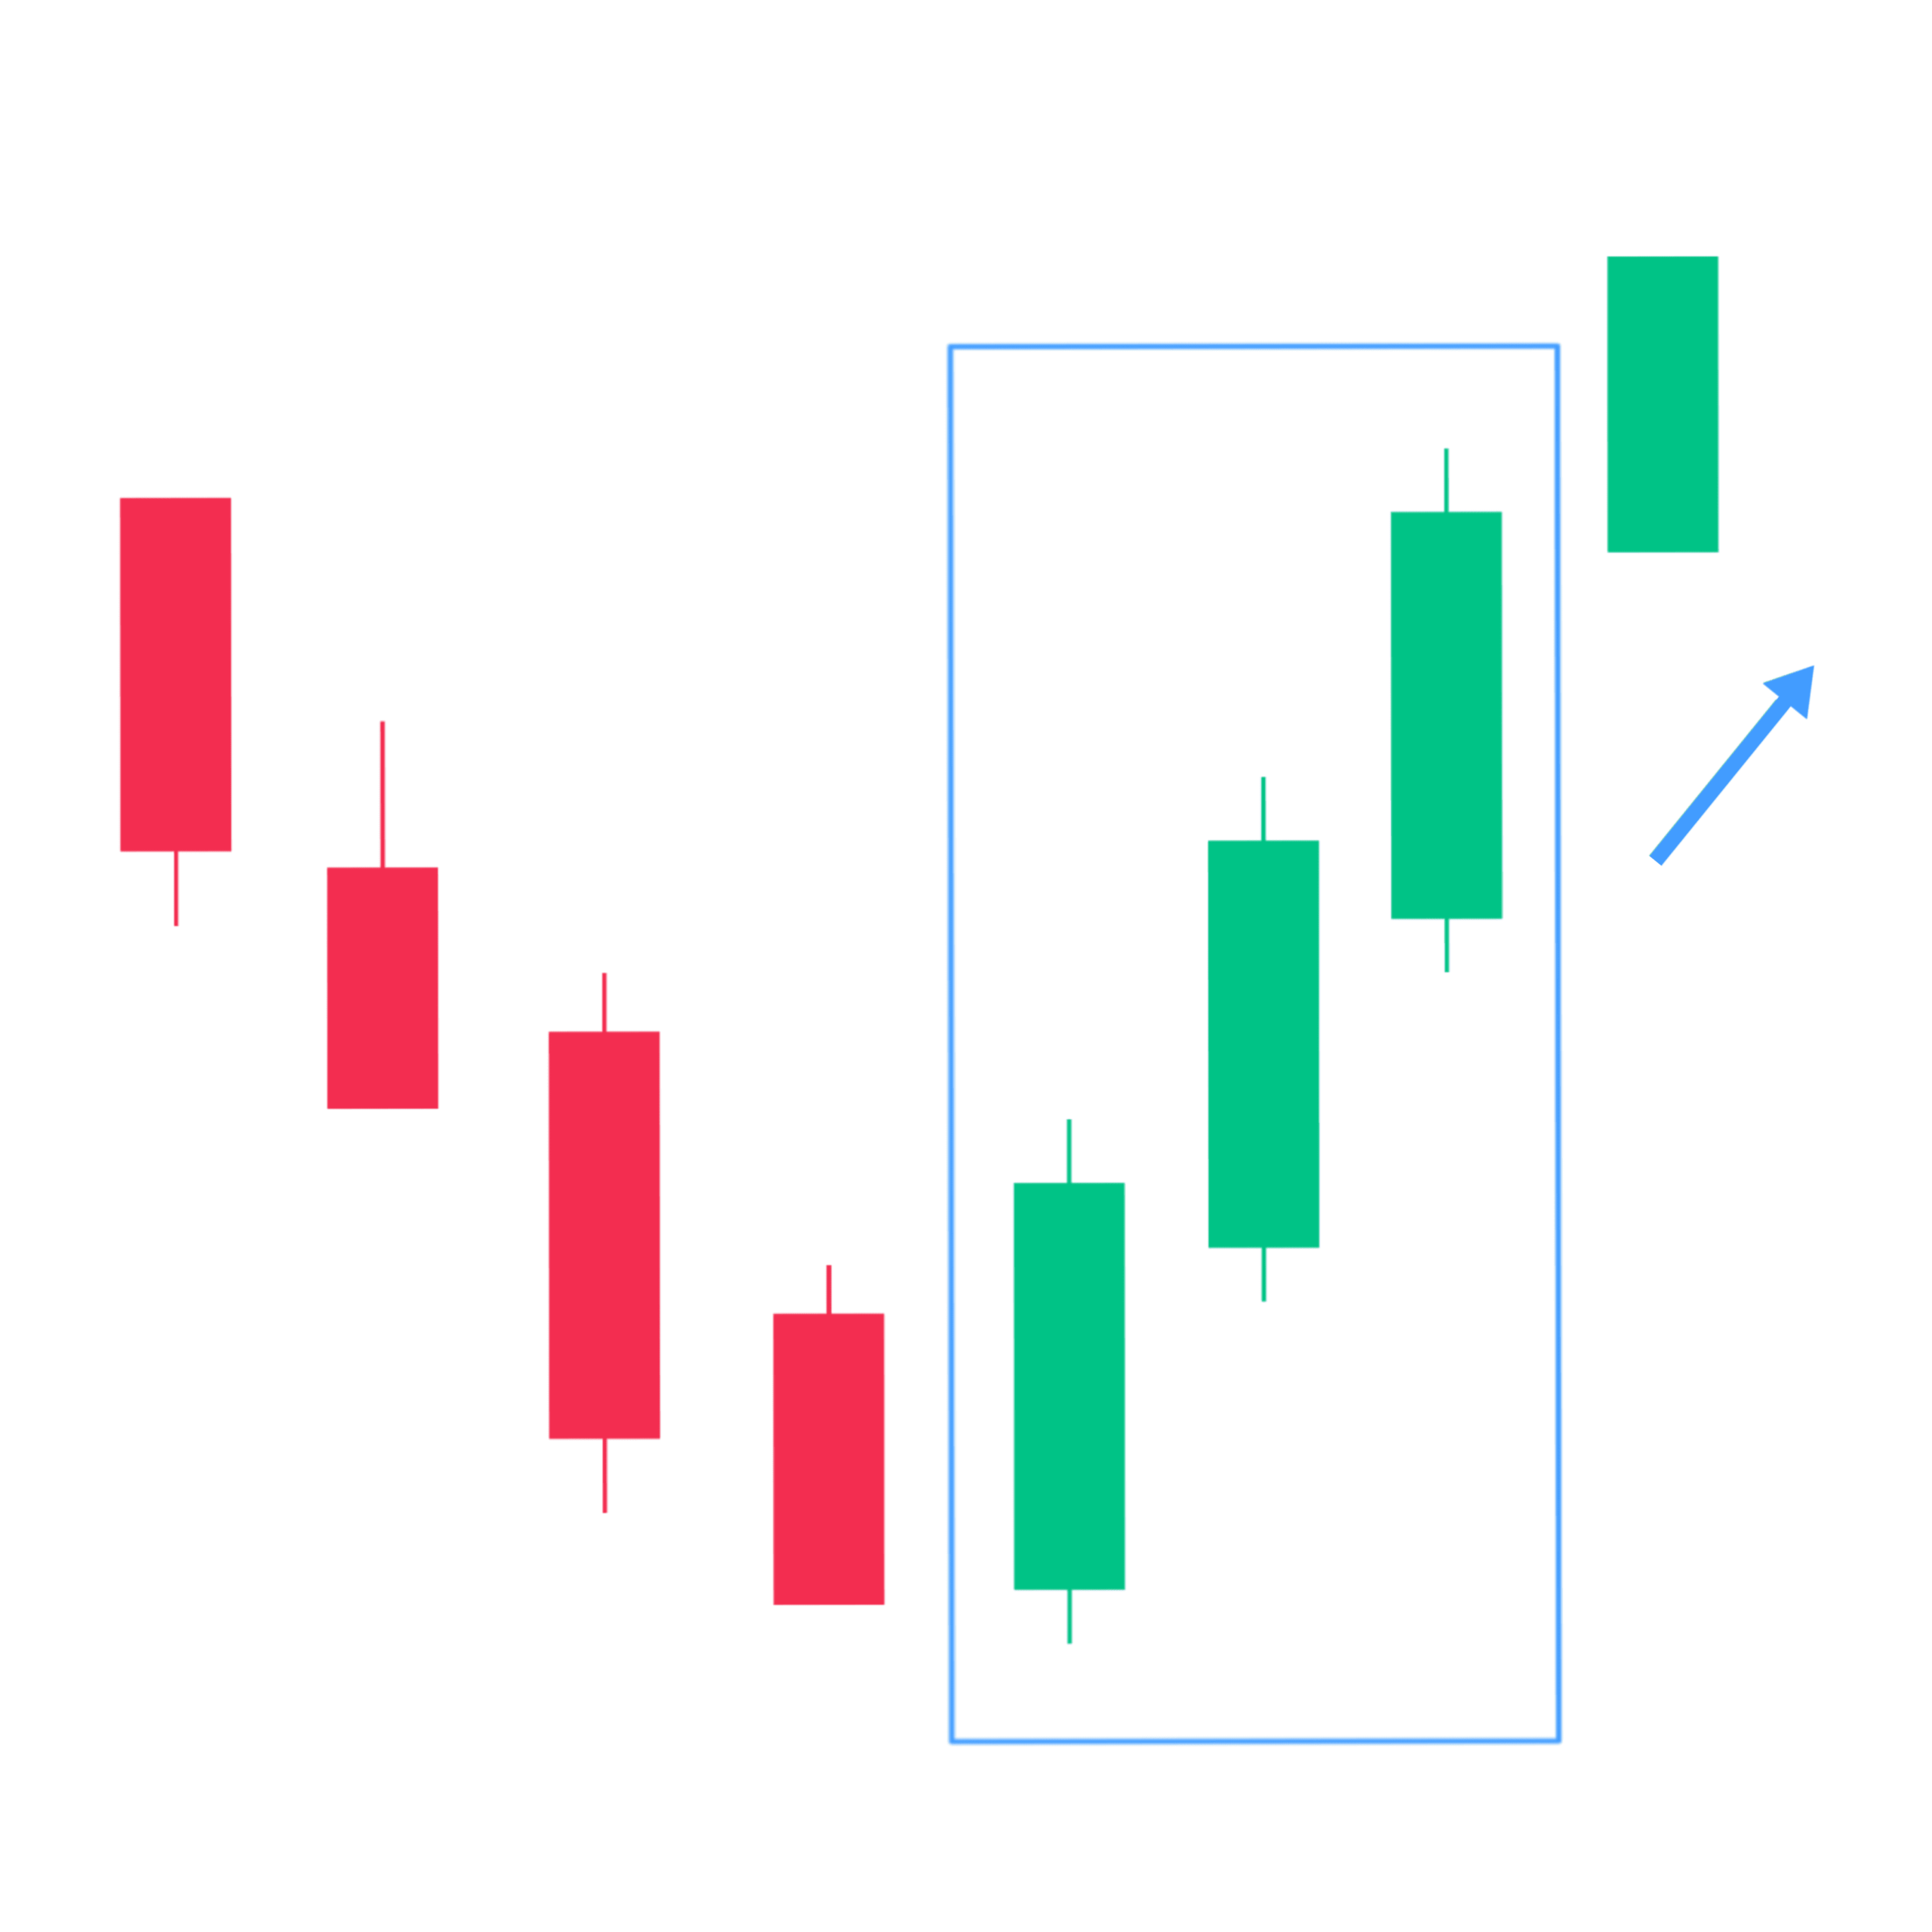
6. Three White Soldiers
Three white soldiers is a three-candle pattern that includes three green candles with small wicks. These candles open and close higher than the previous candle.
After a downtrend, this is a strong indication shows steady buying pressure.
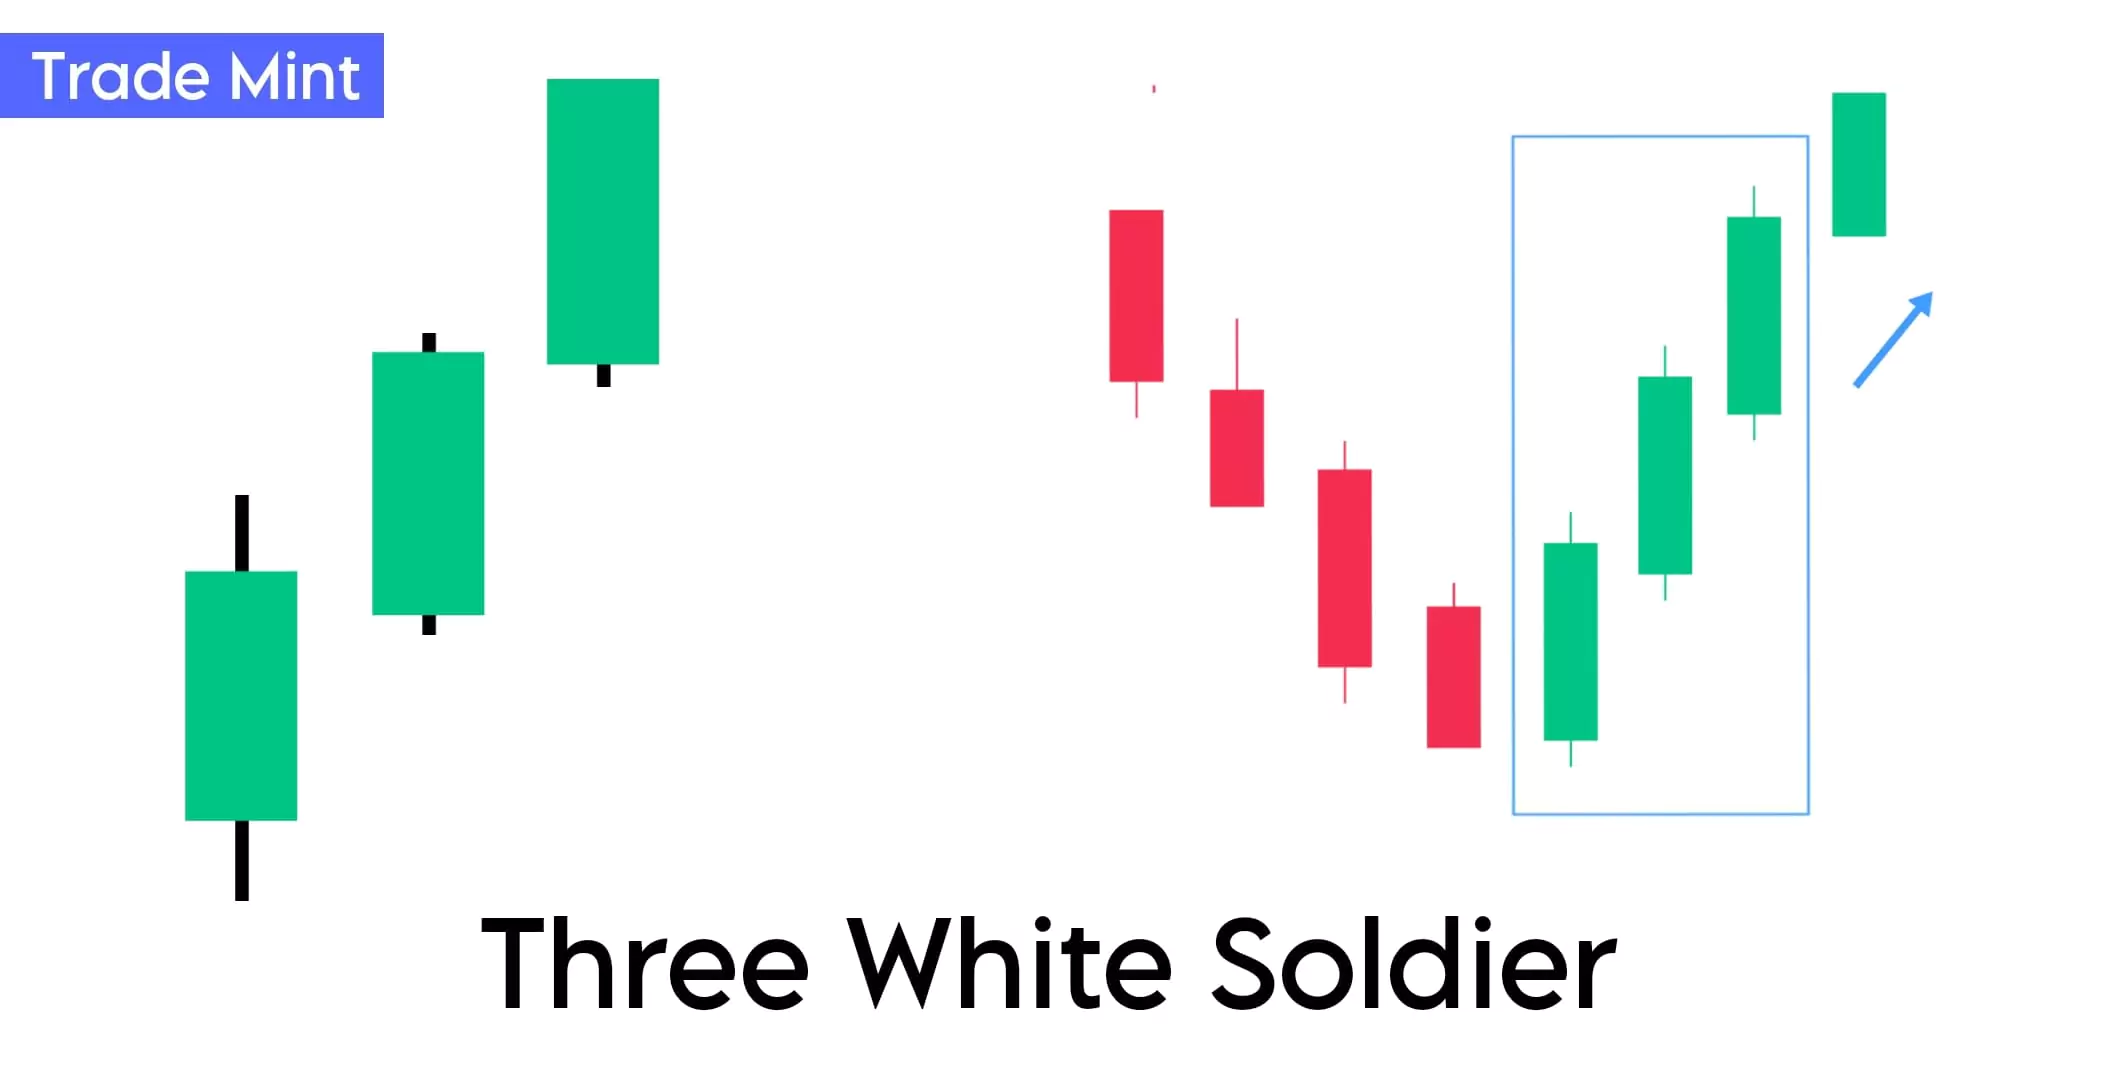
“The three white soldiers pattern is a bullish reversal pattern, consists of three consecutive long green (white) candlesticks with small wicks. Each candle opens higher than the previous day’s close, and the pattern suggests a shift in market sentiment from bearish to bullish.”
It’s a signal that the previous downtrend may be losing momentum and a potential trend reversal to the upside.
Traders use this pattern as a signal to enter long positions or to close out existing short positions.
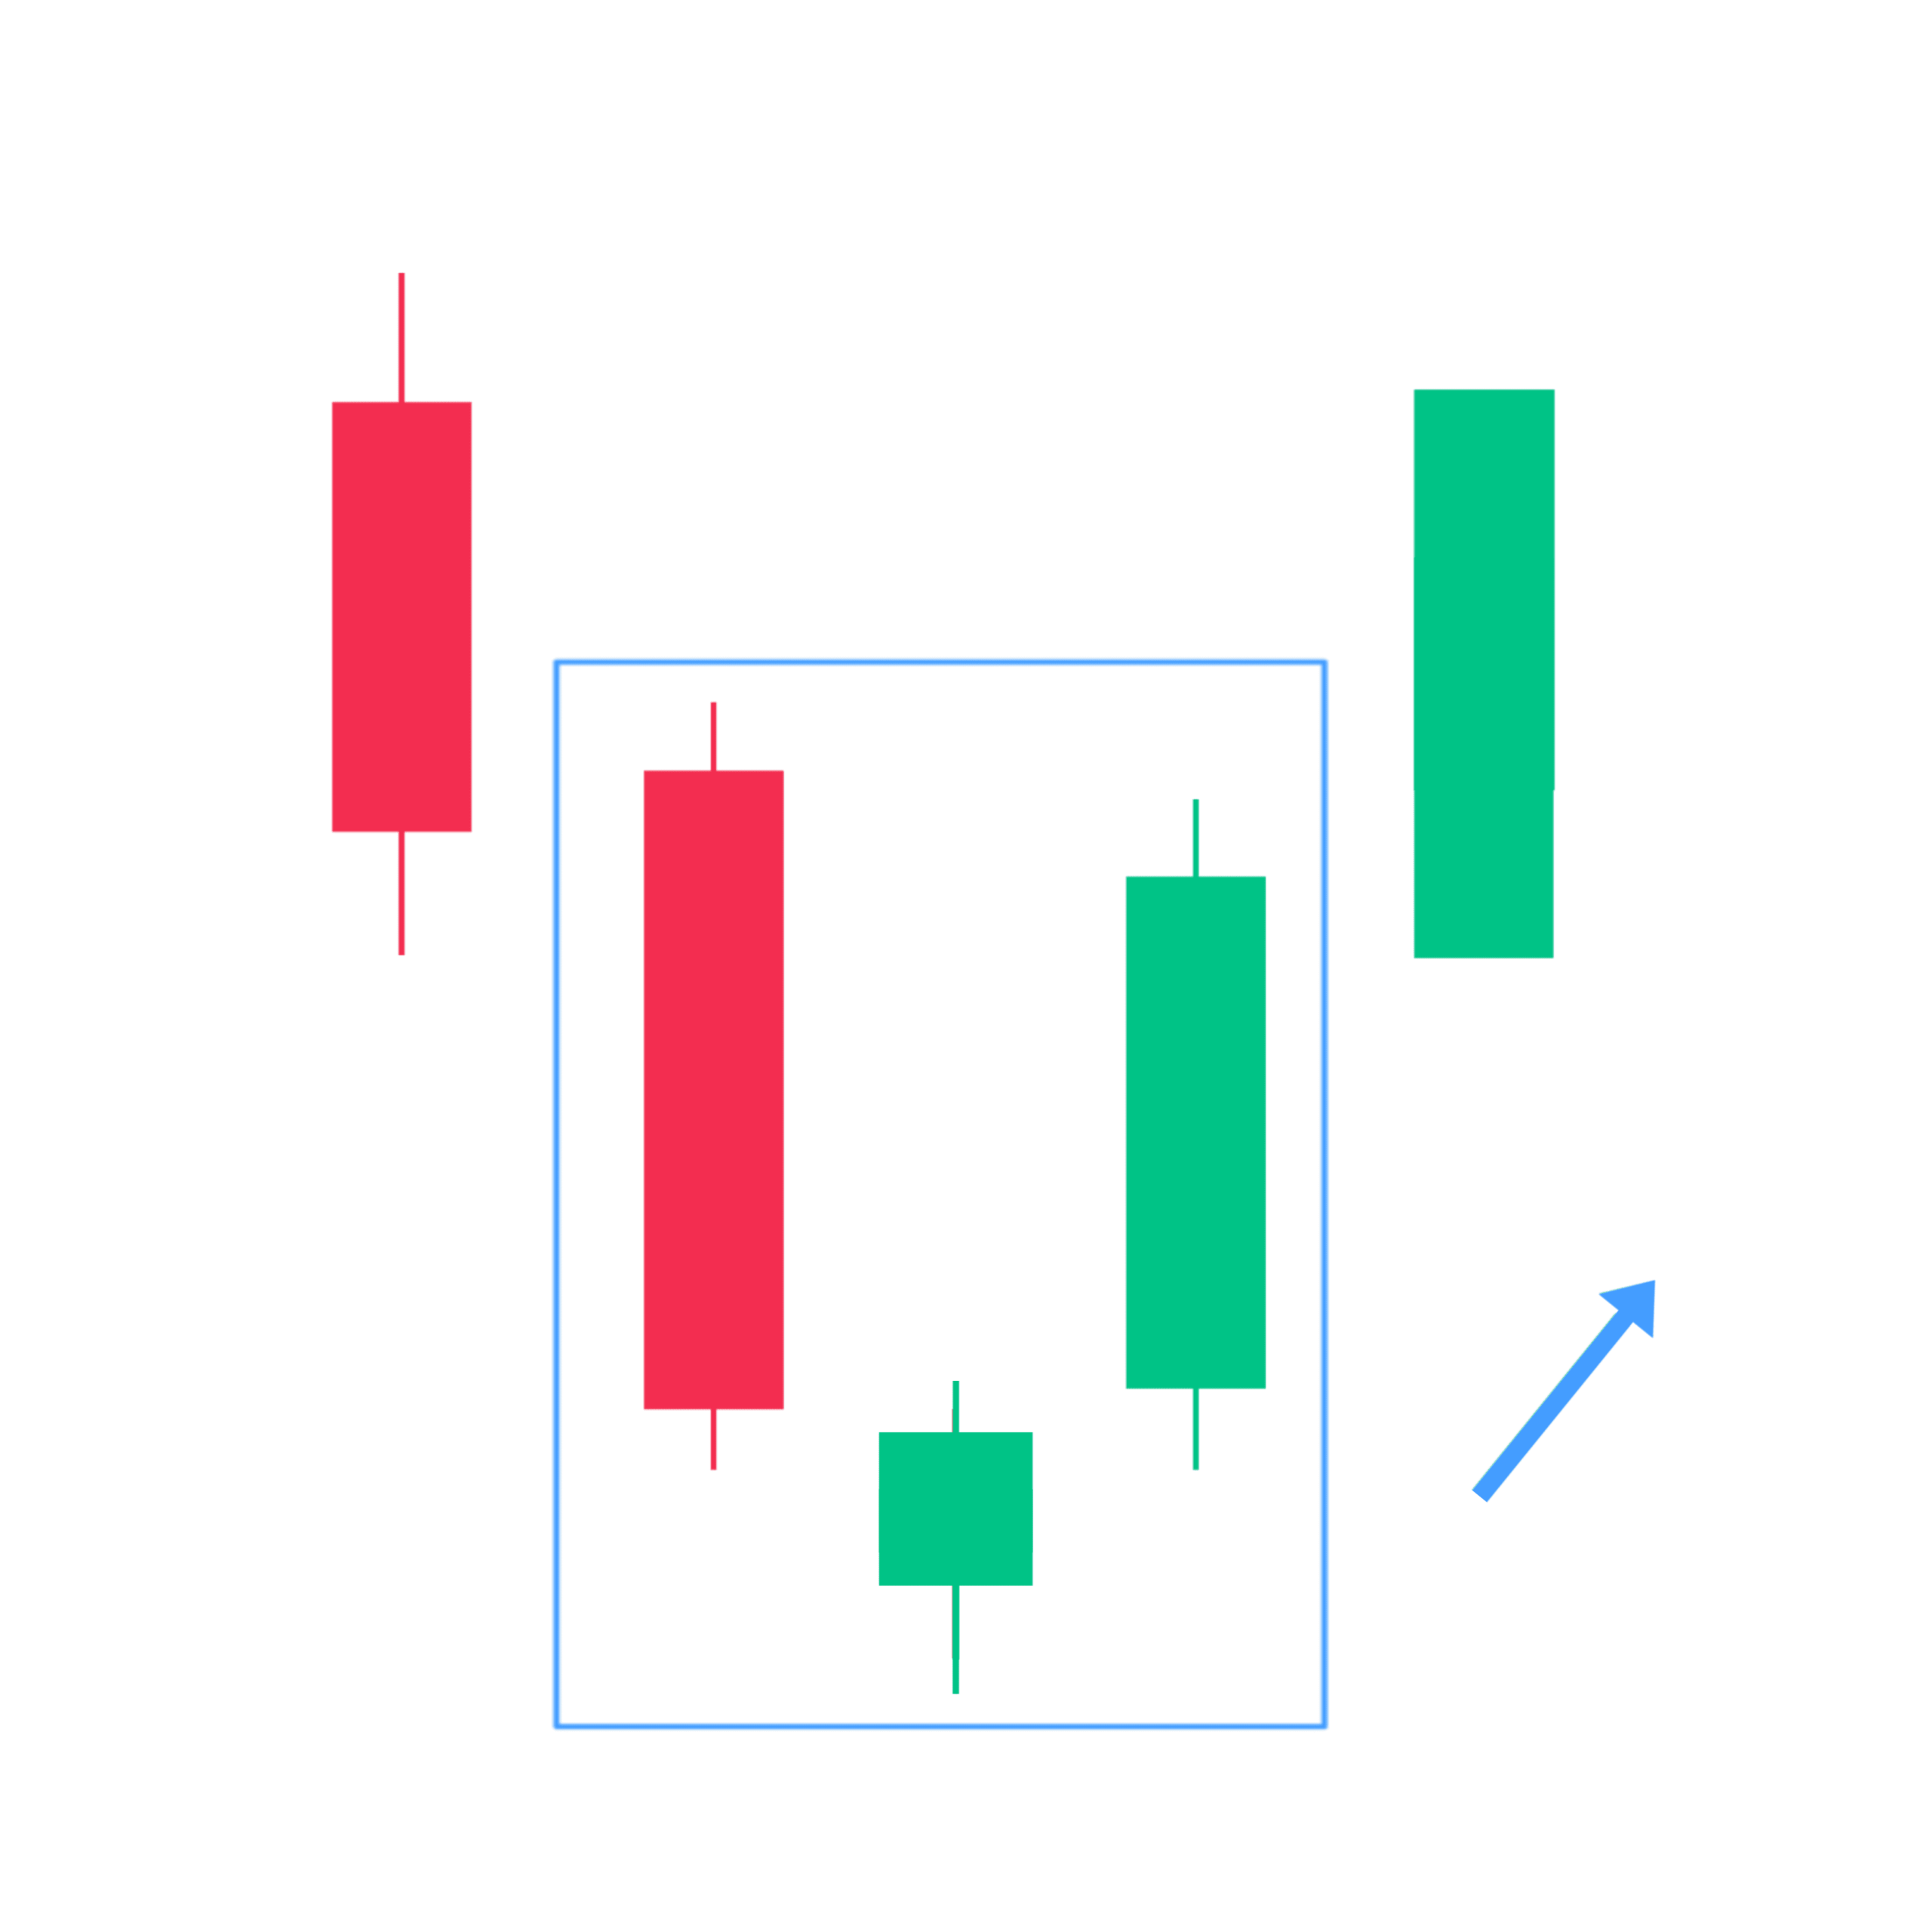
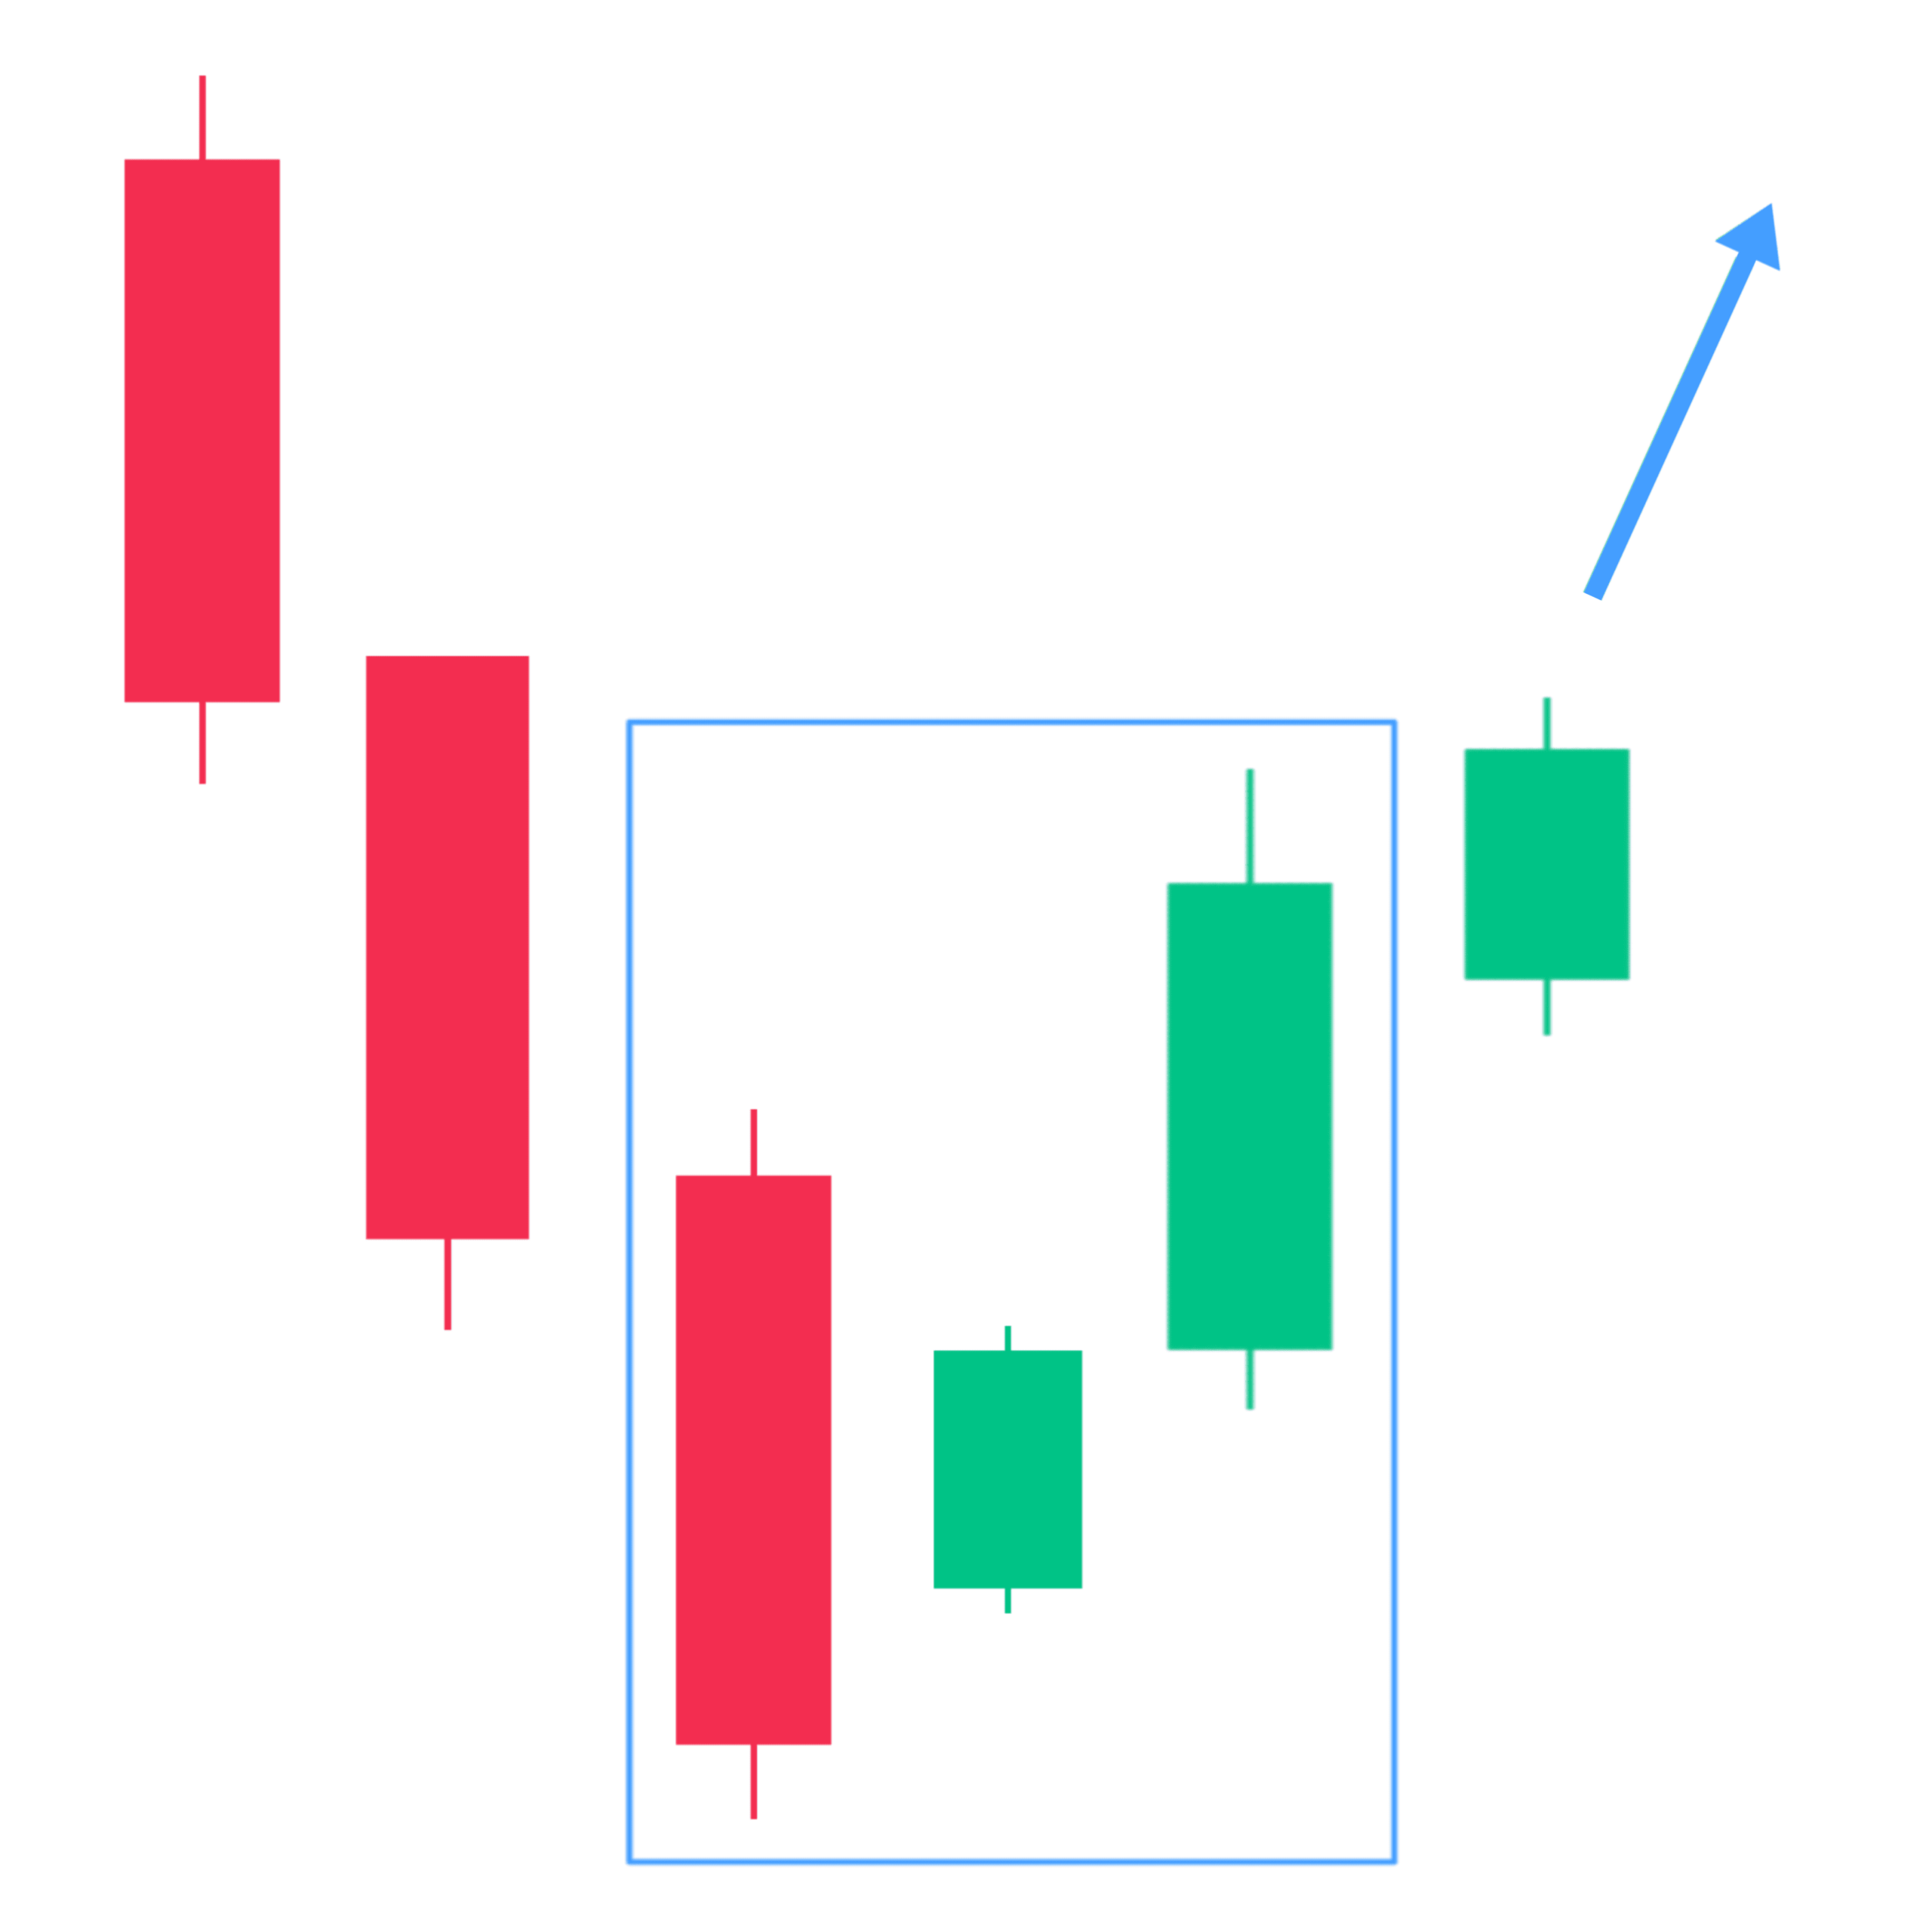
7. Morning Star
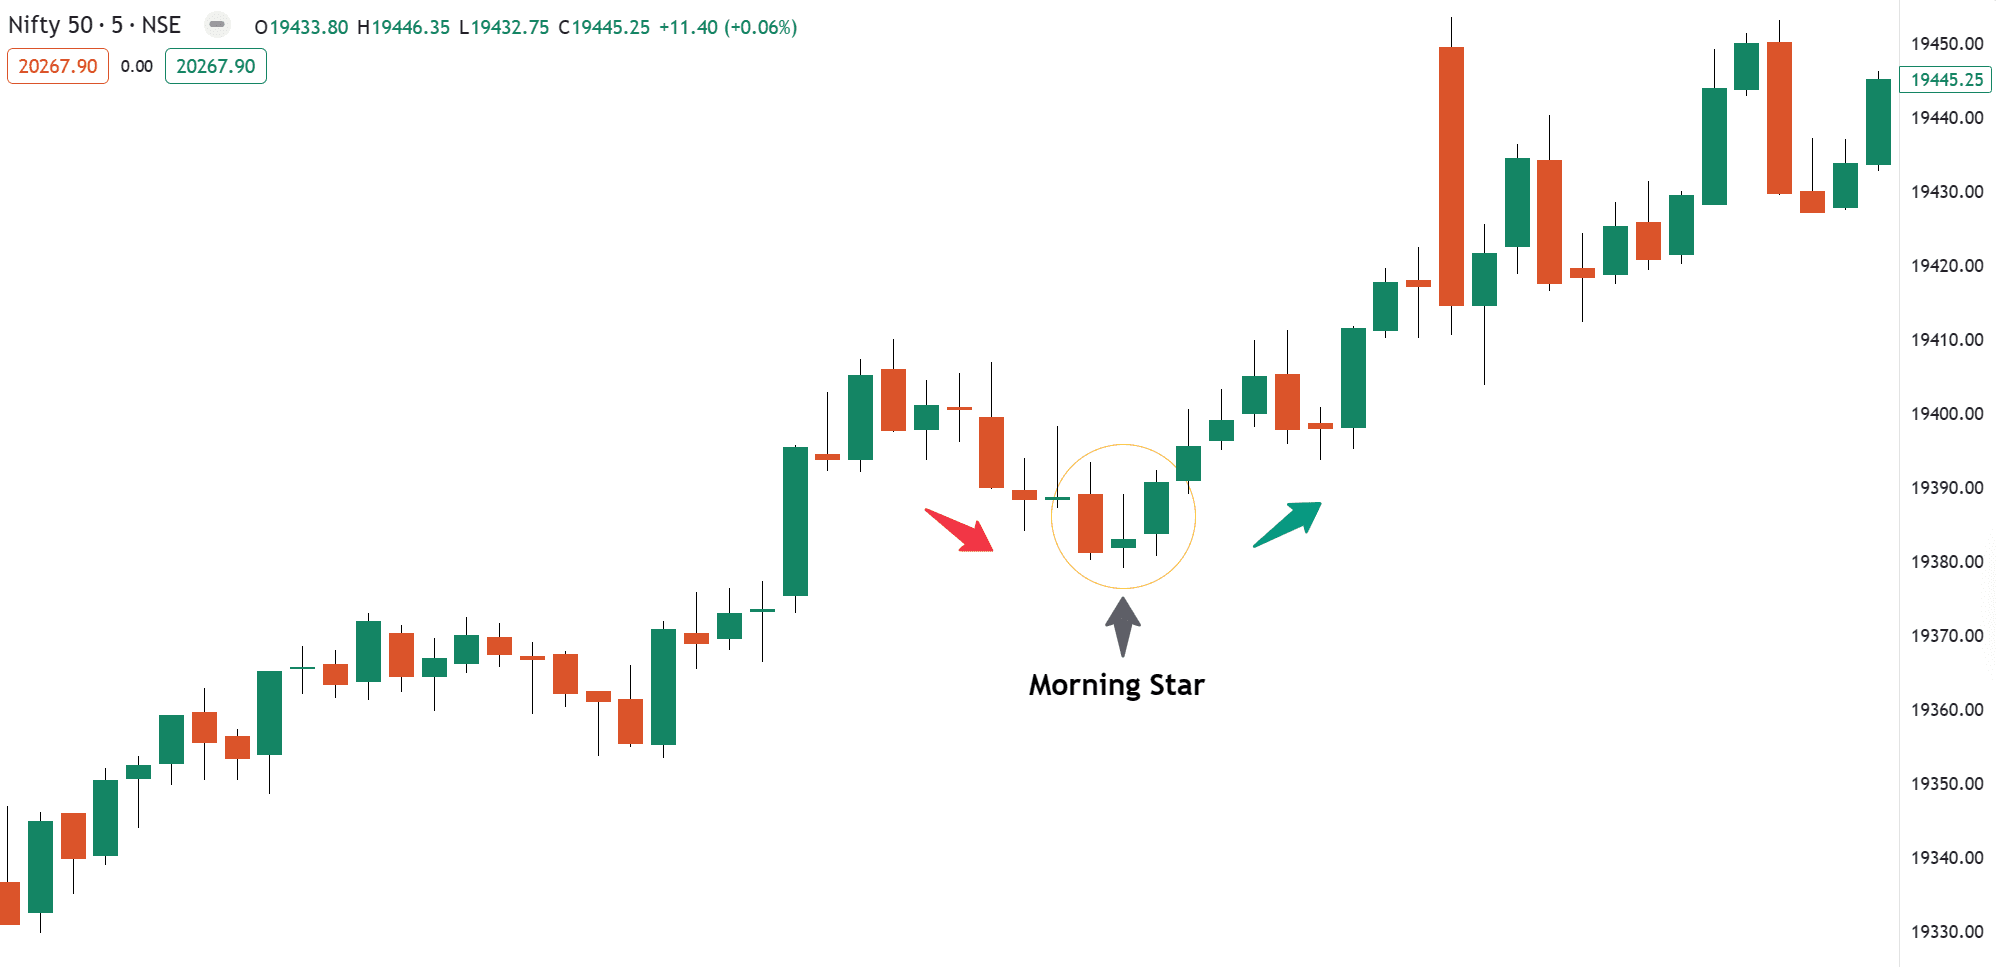
The Morning Star candlestick pattern is a multiple candlestick pattern, Most of the traders use Morning Star candlesticks in their trading as a strategy to identify potential buying opportunities, It is treated as a bullish reversal, but only when it appears under certain conditions

“The morning star candlestick pattern is a three-candlestick pattern that signifies bullish sentiment in the market and shows the potential reversal after a downtrend. The first is a bearish candle, the second is a small-bodied candle indicating indecision and the third one is a strong bullish candle that shows now change the bearish to bullish sentiment.”
Guide: Traders should enter long positions only after the confirmation of the third candle closing above the candle and it completely showing rising pressure. Now, a stop-loss can be placed at the low of the second candle.
As the morning star appears just before sunrise…..
It is simple to recognize the Morning Star Candlestick patterns just you can see this image, once you are familiar with them, this pattern offers traders good risk-to-reward ratios.
Below is an example of Morning Star Candlestick Pattern
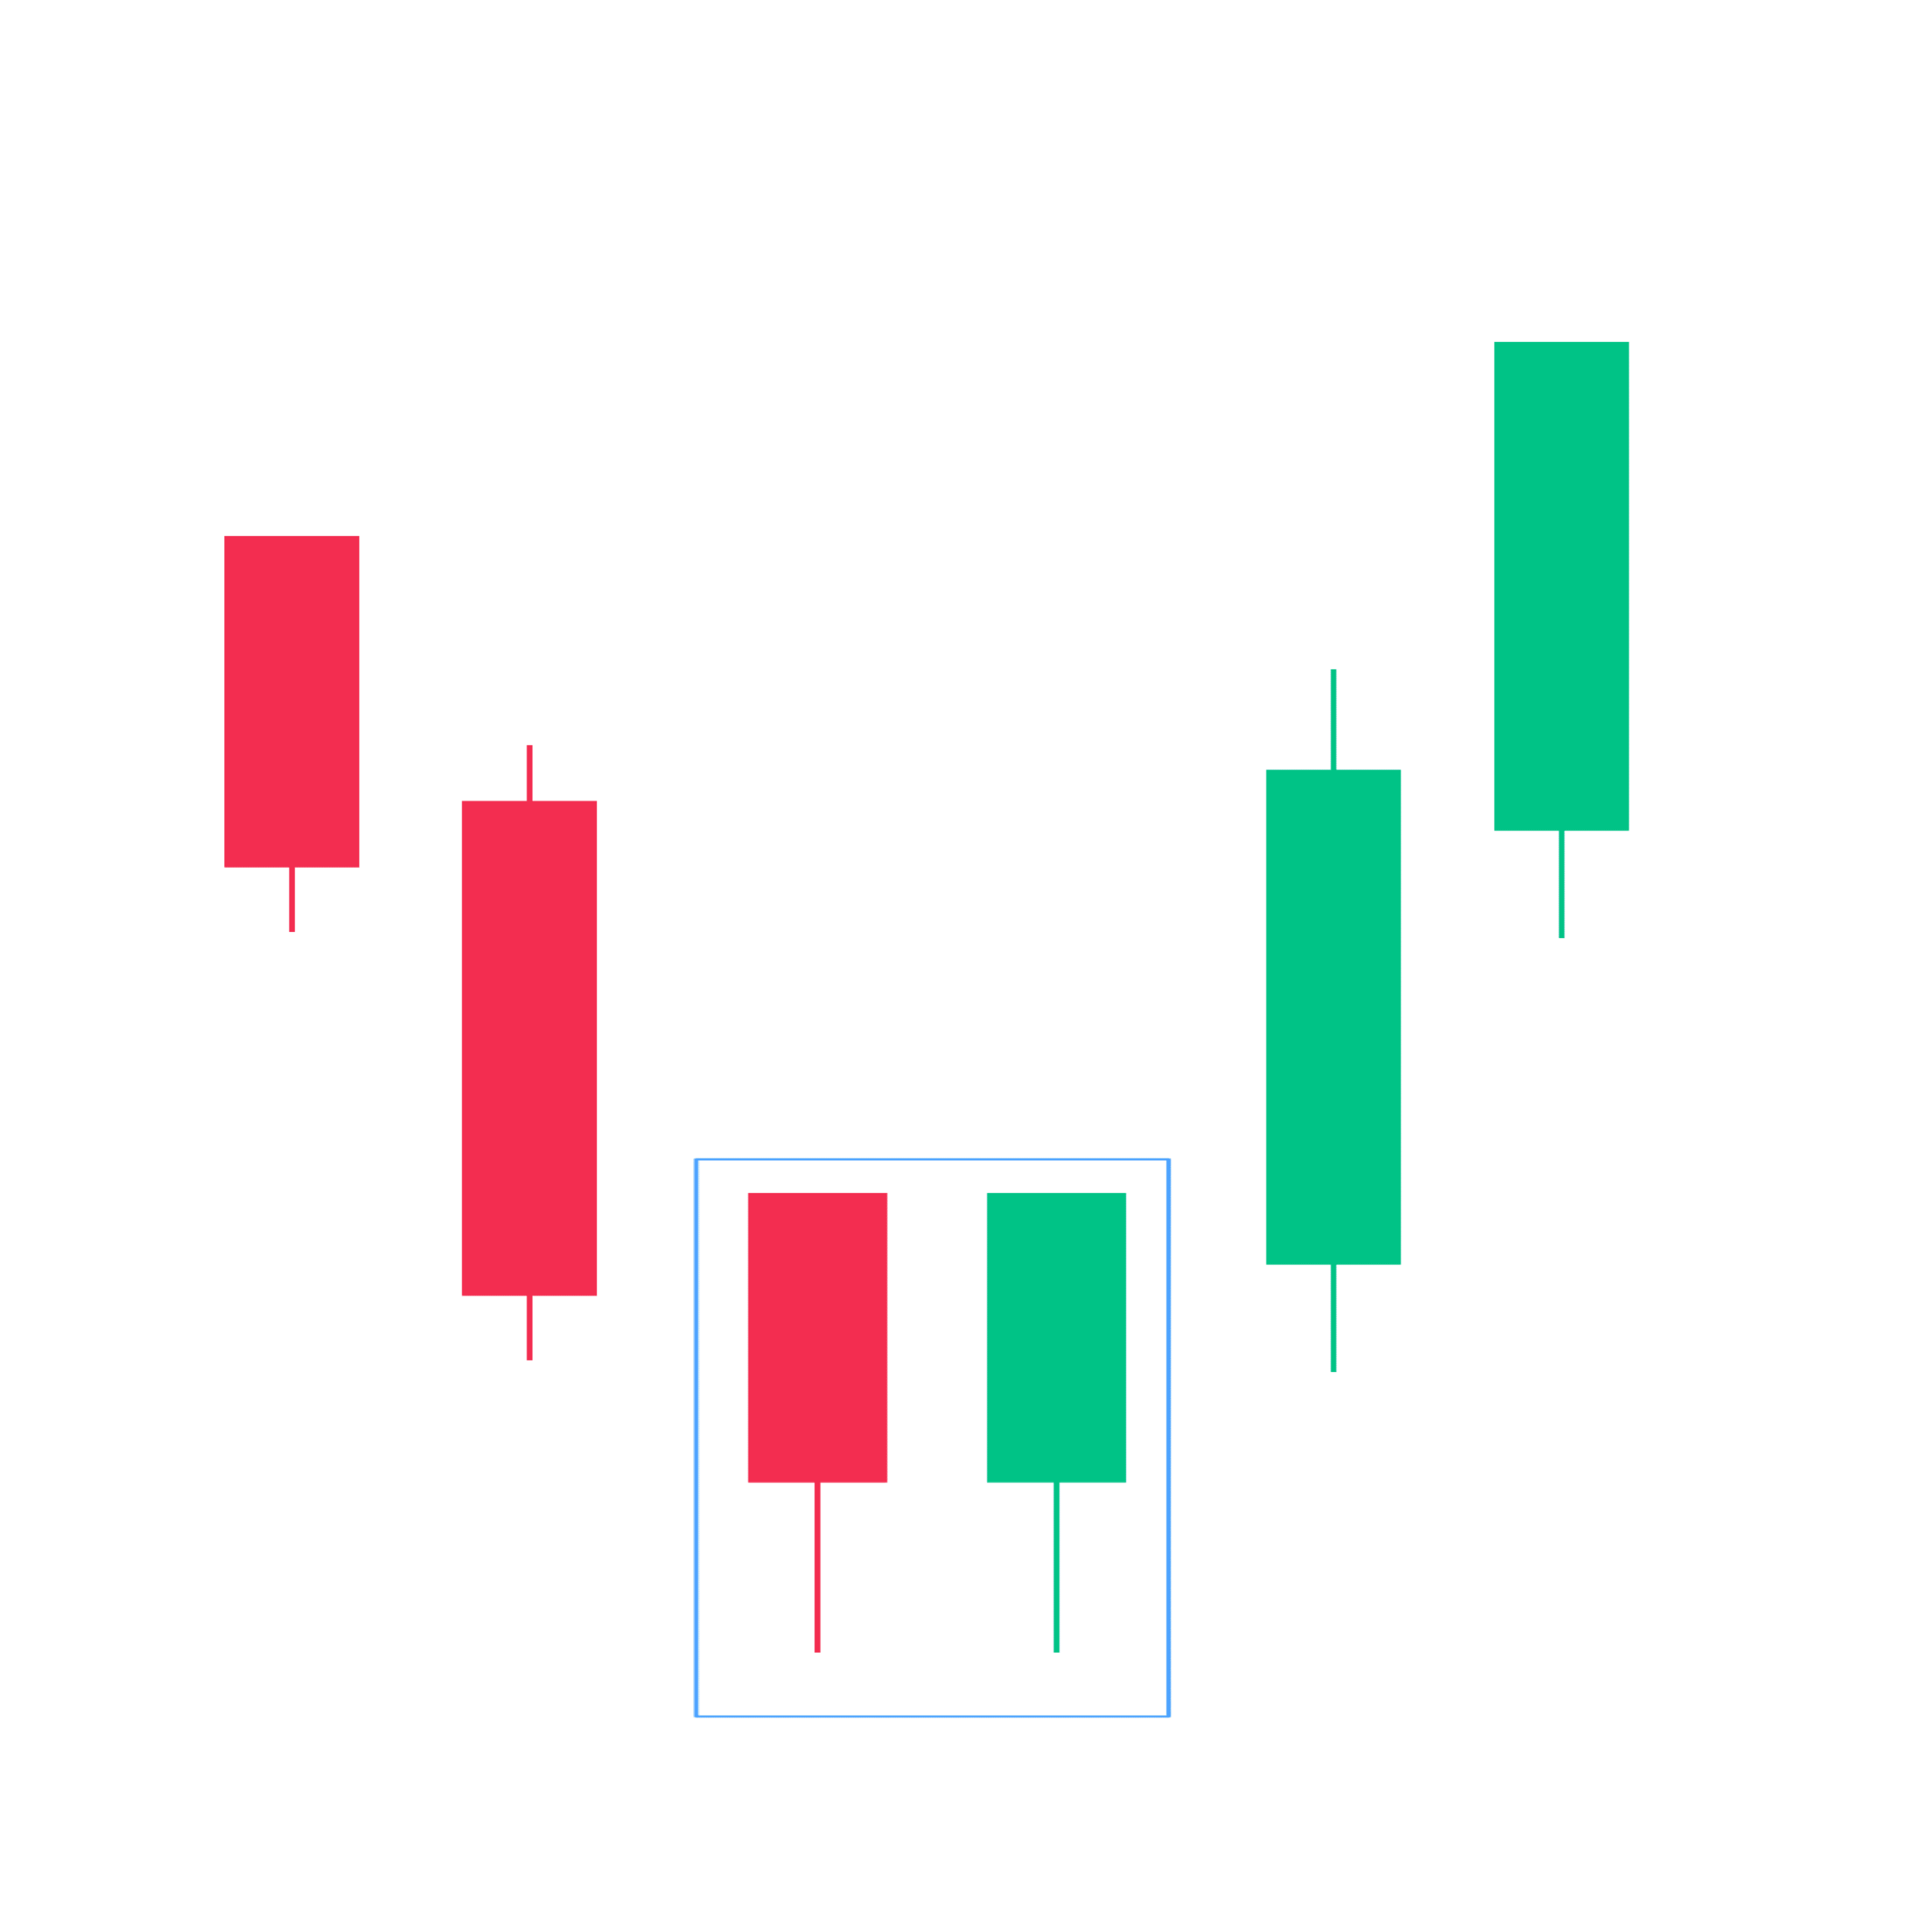
8. Tweezer Bottom
A Tweezer Bottom is a bullish reversal pattern seen at the bottom of downtrends and consists of two candlesticks with matching bottoms or the same low.
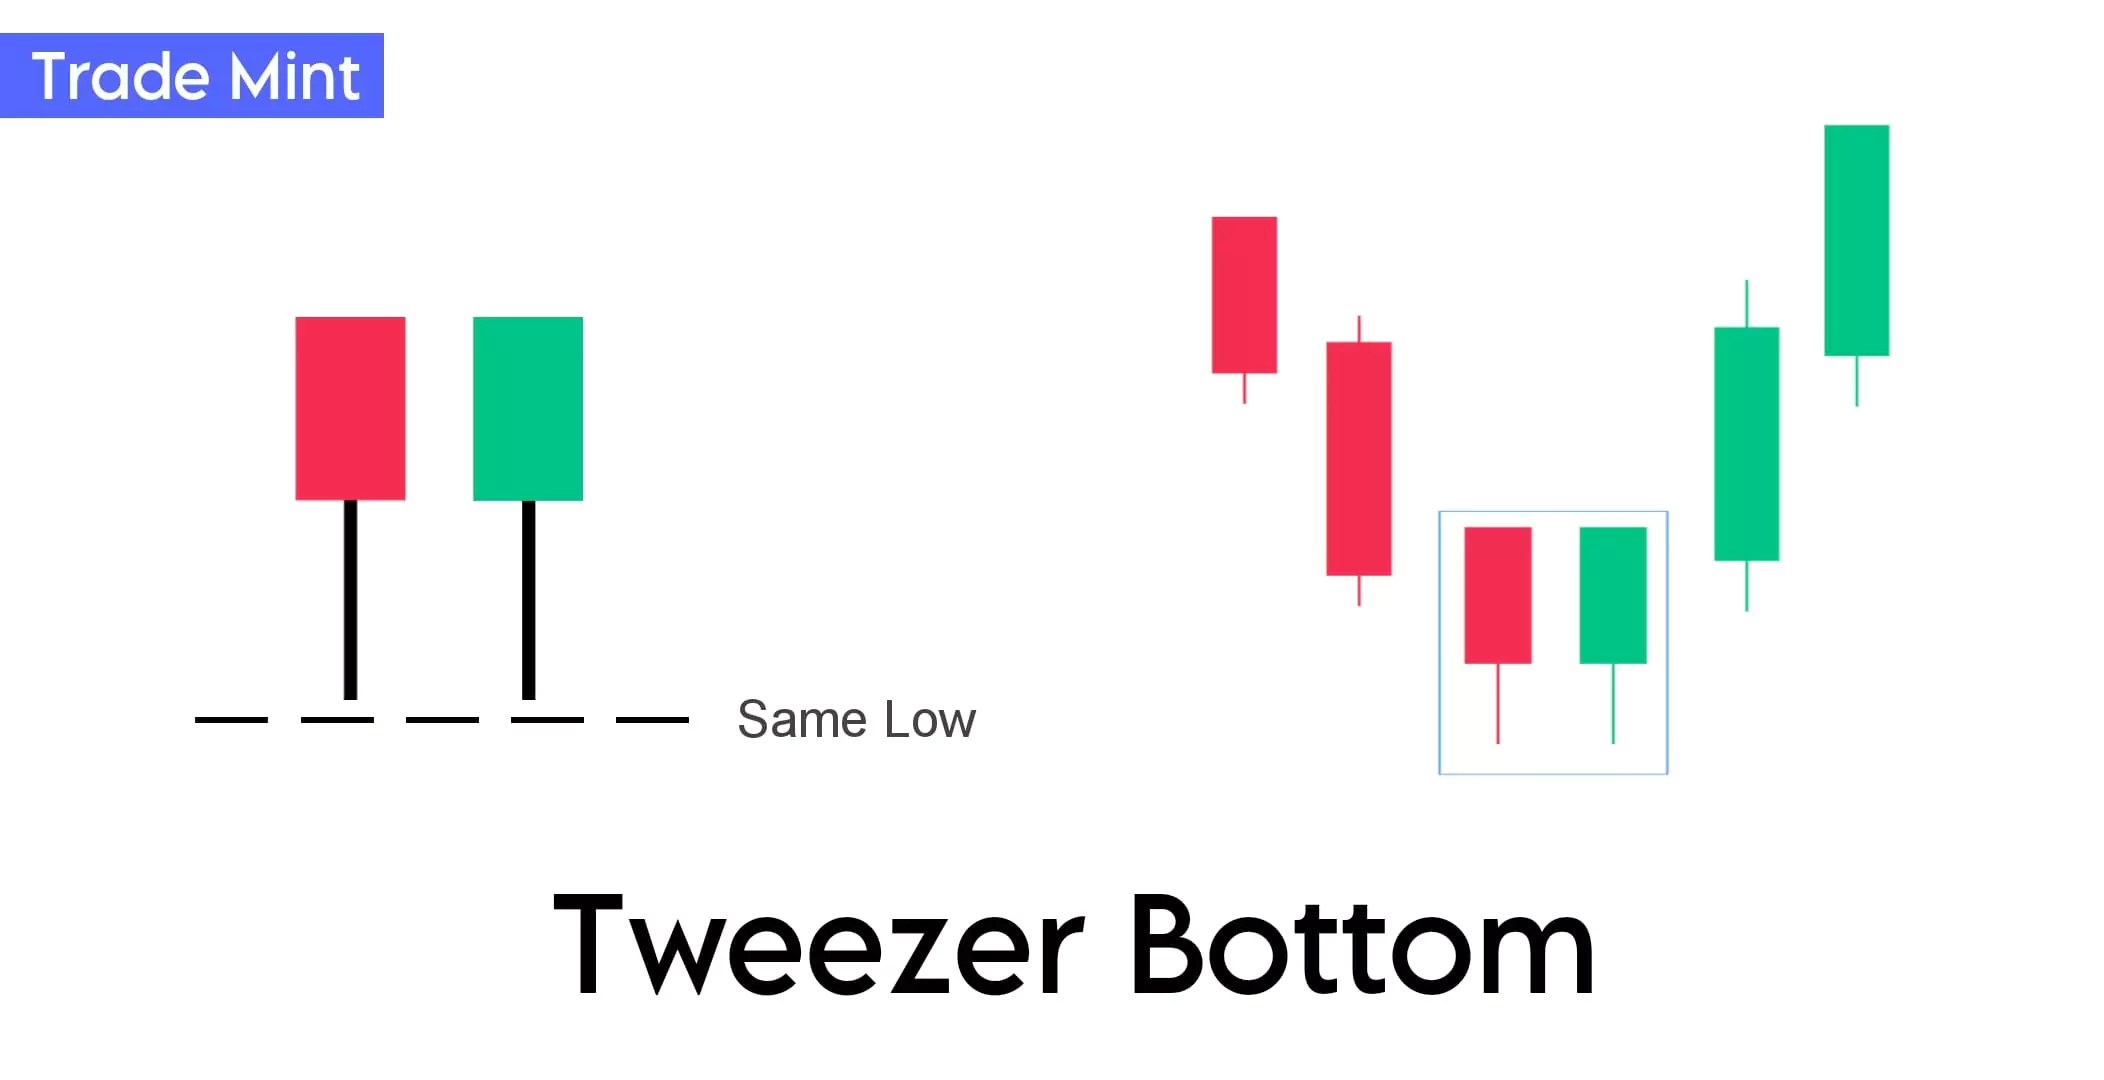
“The Tweezer Bottom is a bullish reversal candlestick pattern that occurs at the end of a downtrend. It forms when two consecutive candlesticks have similar or equal lows, creating a pattern that looks like tweezers.”
The first bearish candle indicates continued selling pressure, and the next candle formed bullish and has a similar or equal low to the previous bearish candle. It signifies a potential exhaustion of selling pressure.
Since two or more candles formed shadows at this same level confirms the strength of the support and shows that the downtrend has likely paused, and has reversed into an uptrend.
This pattern indicates a struggle between sellers and buyers and can signal a potential trend reversal. Traders use the Tweezer Bottom pattern as a signal to consider entering into long positions because This formation indicates that buyers are entering the market, as they were able to push the market price from the low reached by the first candlestick.
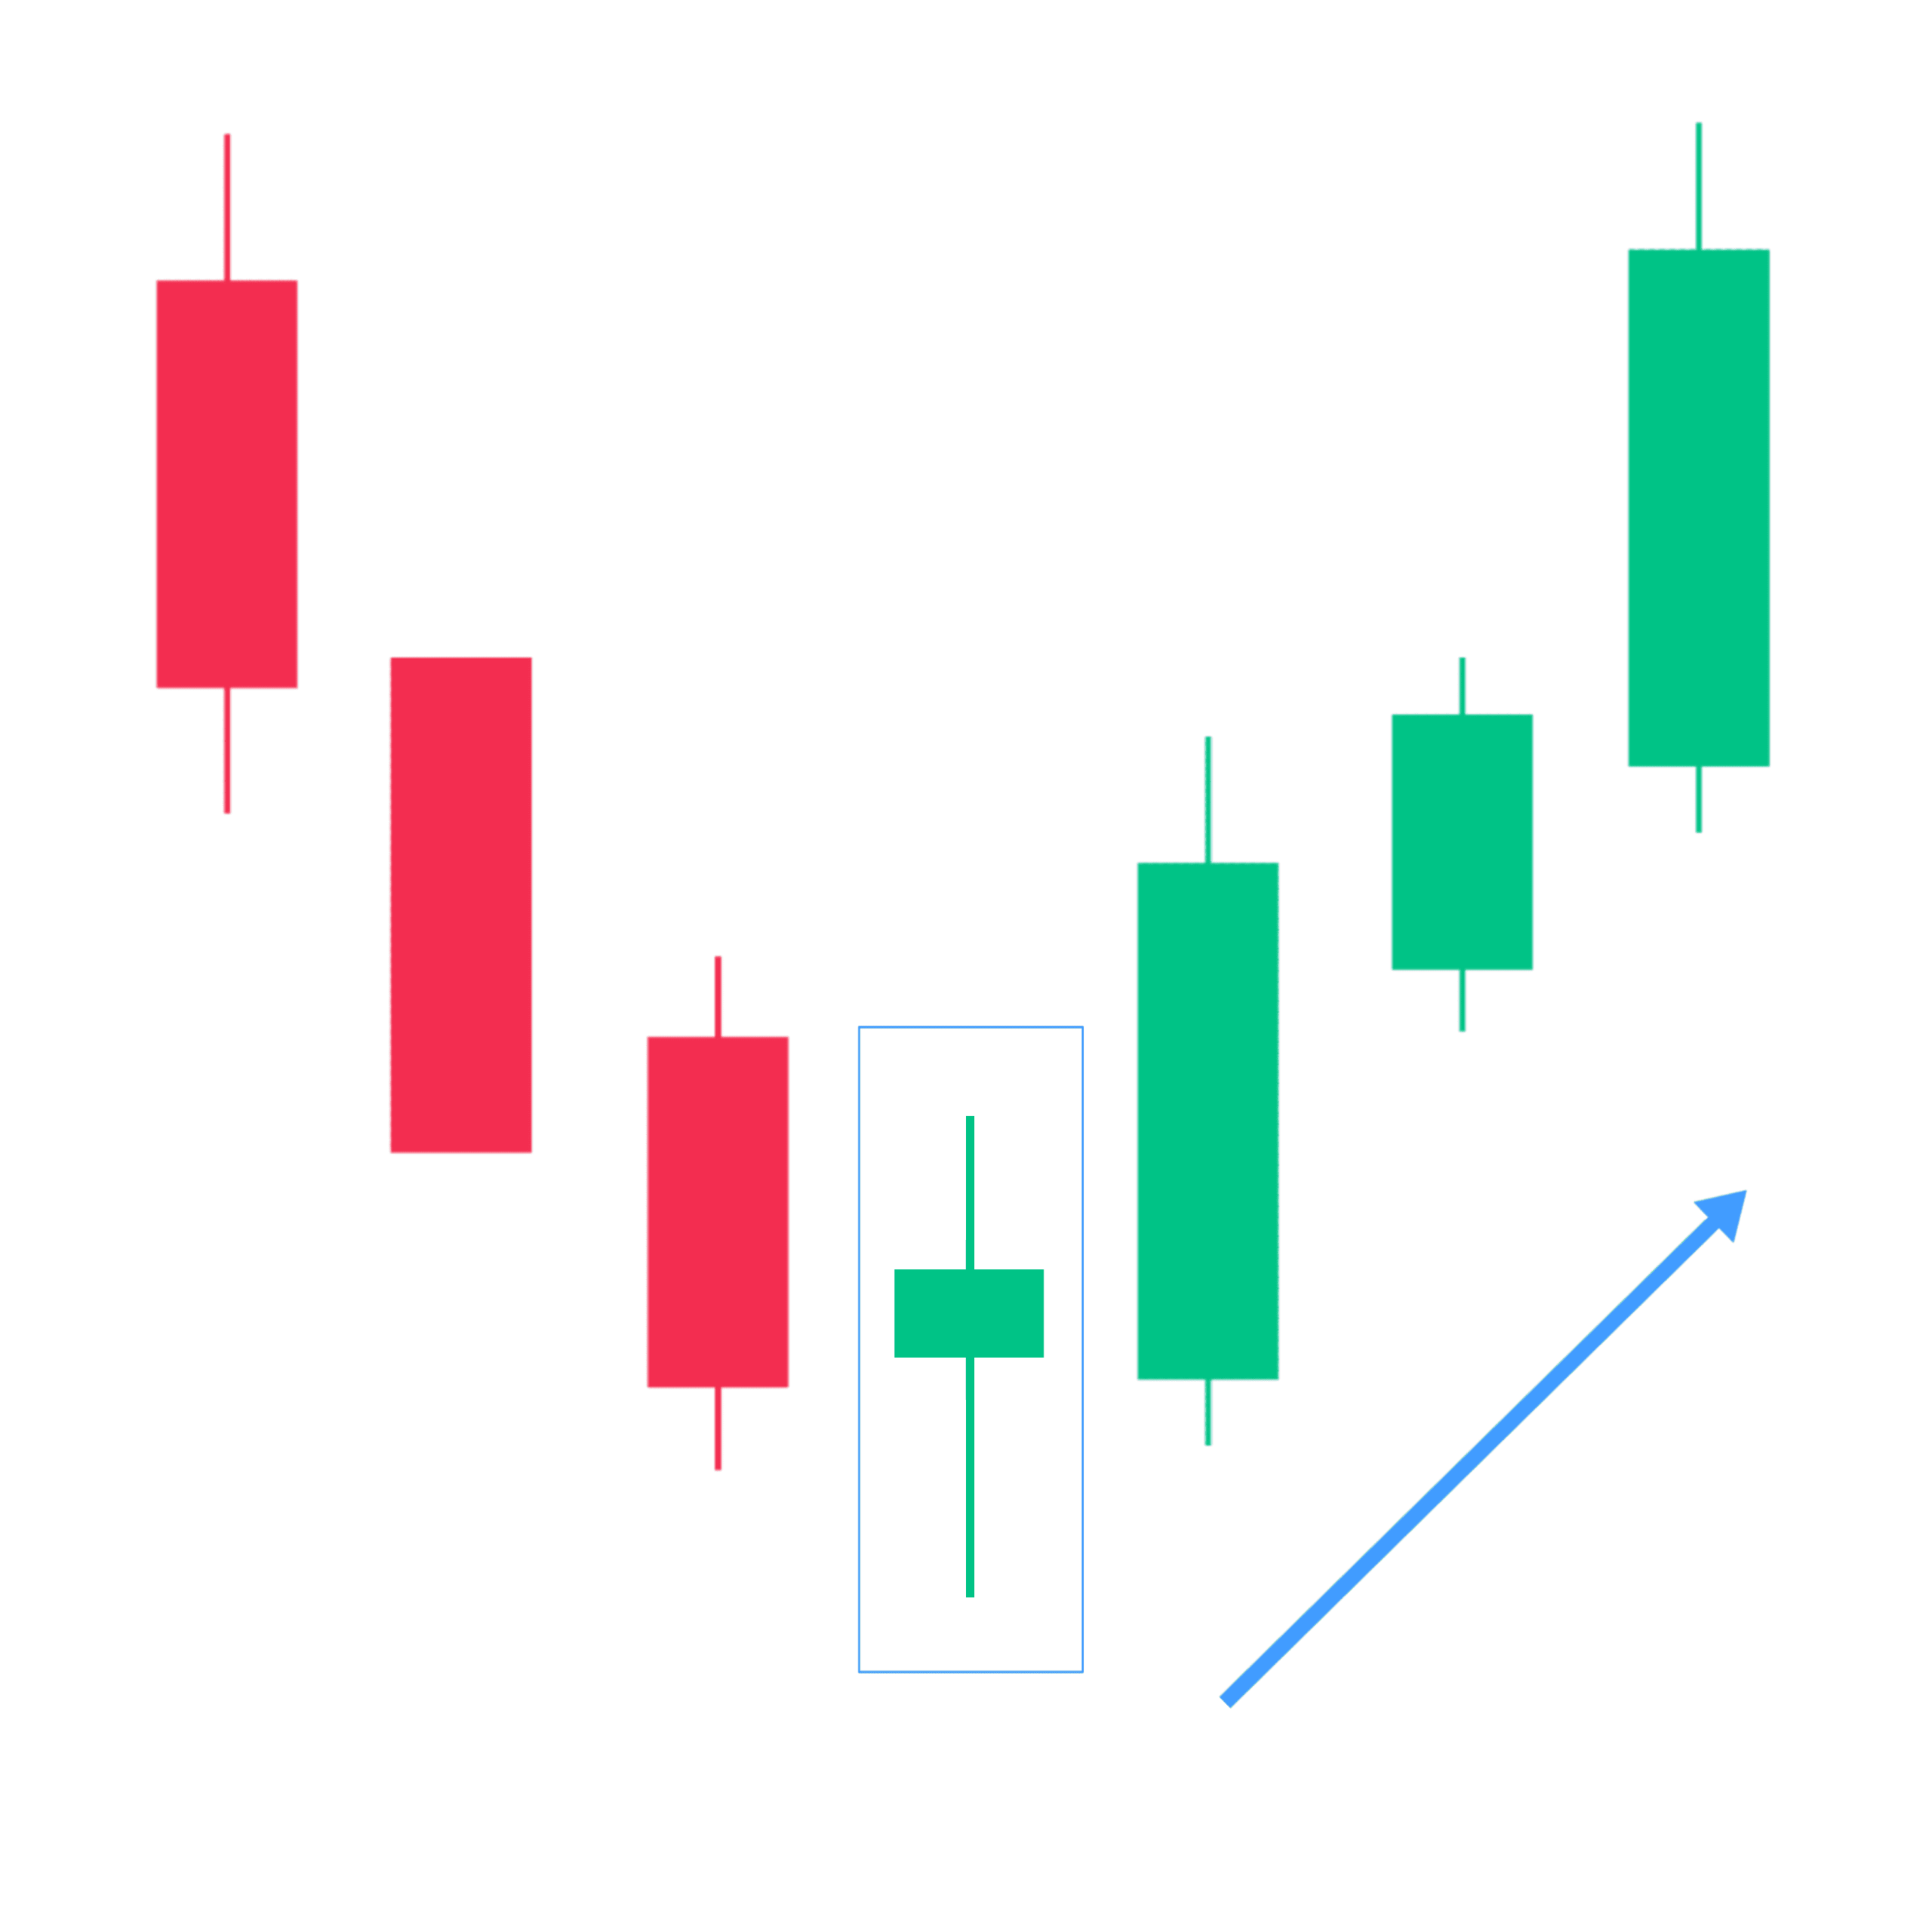
9. Dragonfly Doji
The Dragonfly Doji is a candlestick pattern that can signal a potential reversal in the market.
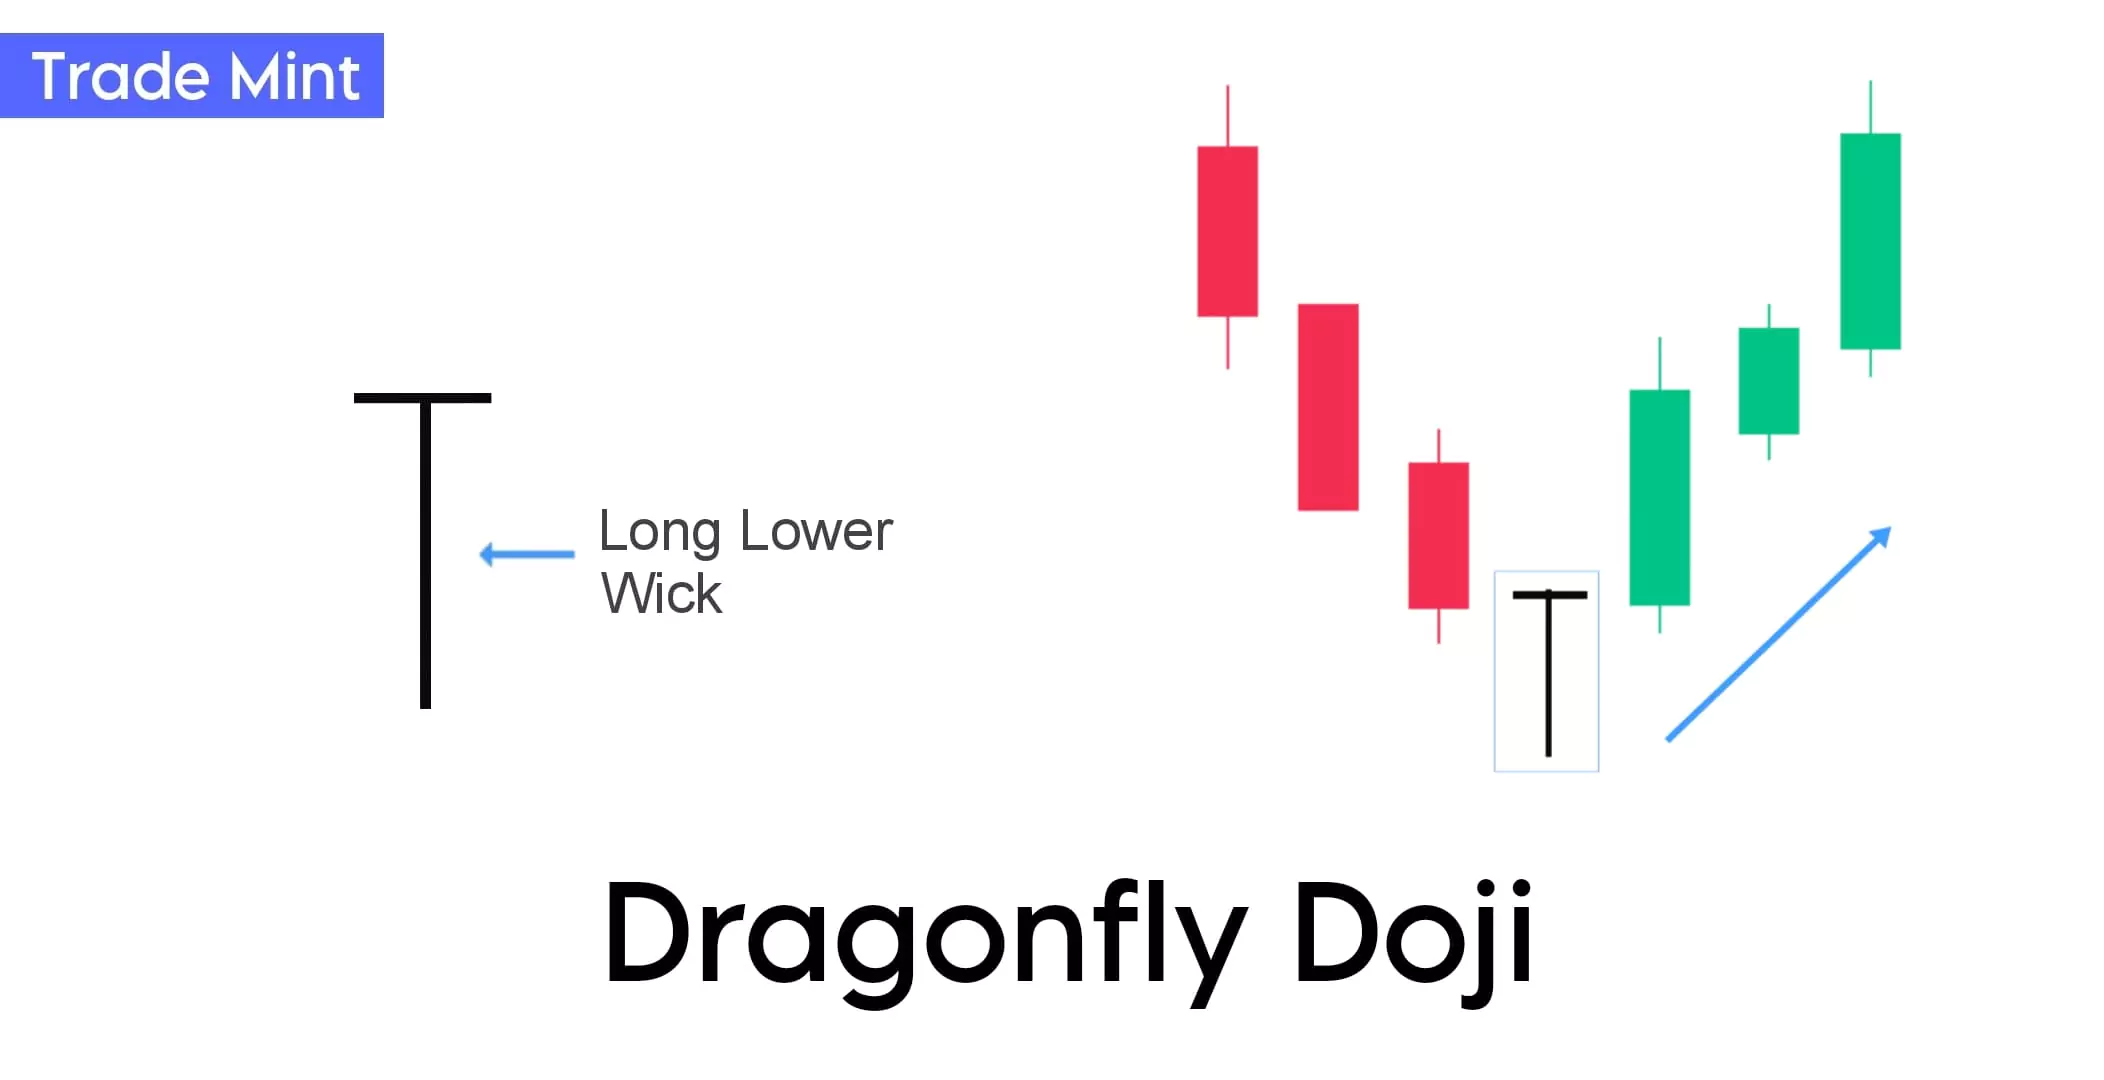
“The Dragonfly Doji is a single candlestick pattern that signals a potential trend reversal, It forms when the open, high, and close prices are all the same or very close to each other with a long lower shadow.”
Dragonfly Doji indicates that sellers pushed the price lower during the trading session, but at the end of the session, buyers were able to push the price back up to the opening level.
Dragonfly Doji is very similar to the bullish pin bar patterns except for the size of the body. So pin bars are more reliable.
10. Bullish Counterattack
The Bullish Counterattack is a two-candle pattern that signals a potential reversal from a downtrend to an uptrend. This pattern’s name derives from how the candles move in opposite directions closing like a counterattack.
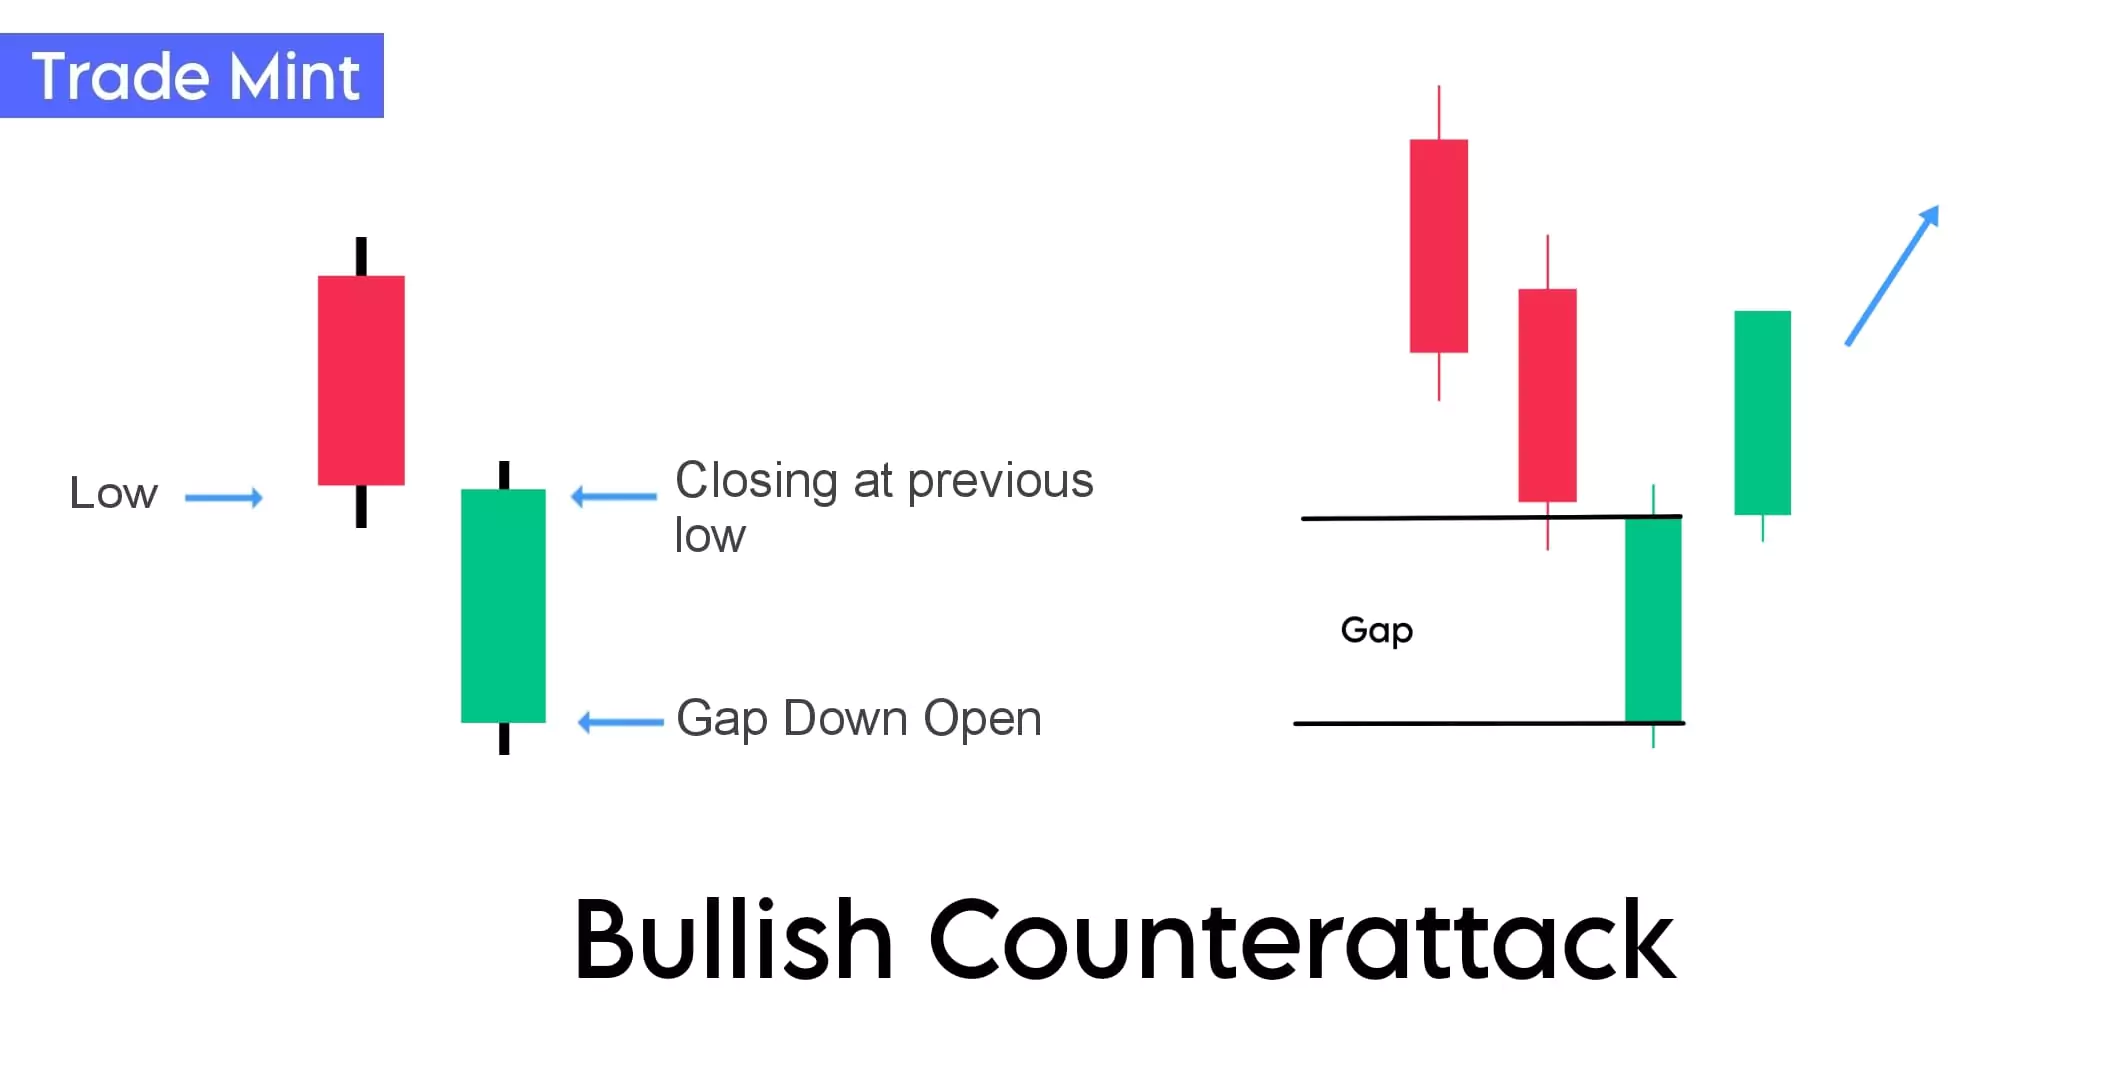
“A bullish counterattack candlestick pattern forms at the bottom of the downtrend. In this pattern, the first candle is red and the second green. The second candle opens after a gap-down but closes at the closing price of the previous candle.”
The above pattern looks like a complicated and rare so you can refer, piercing pattern is stronger than the bullish counterattack candlestick pattern.
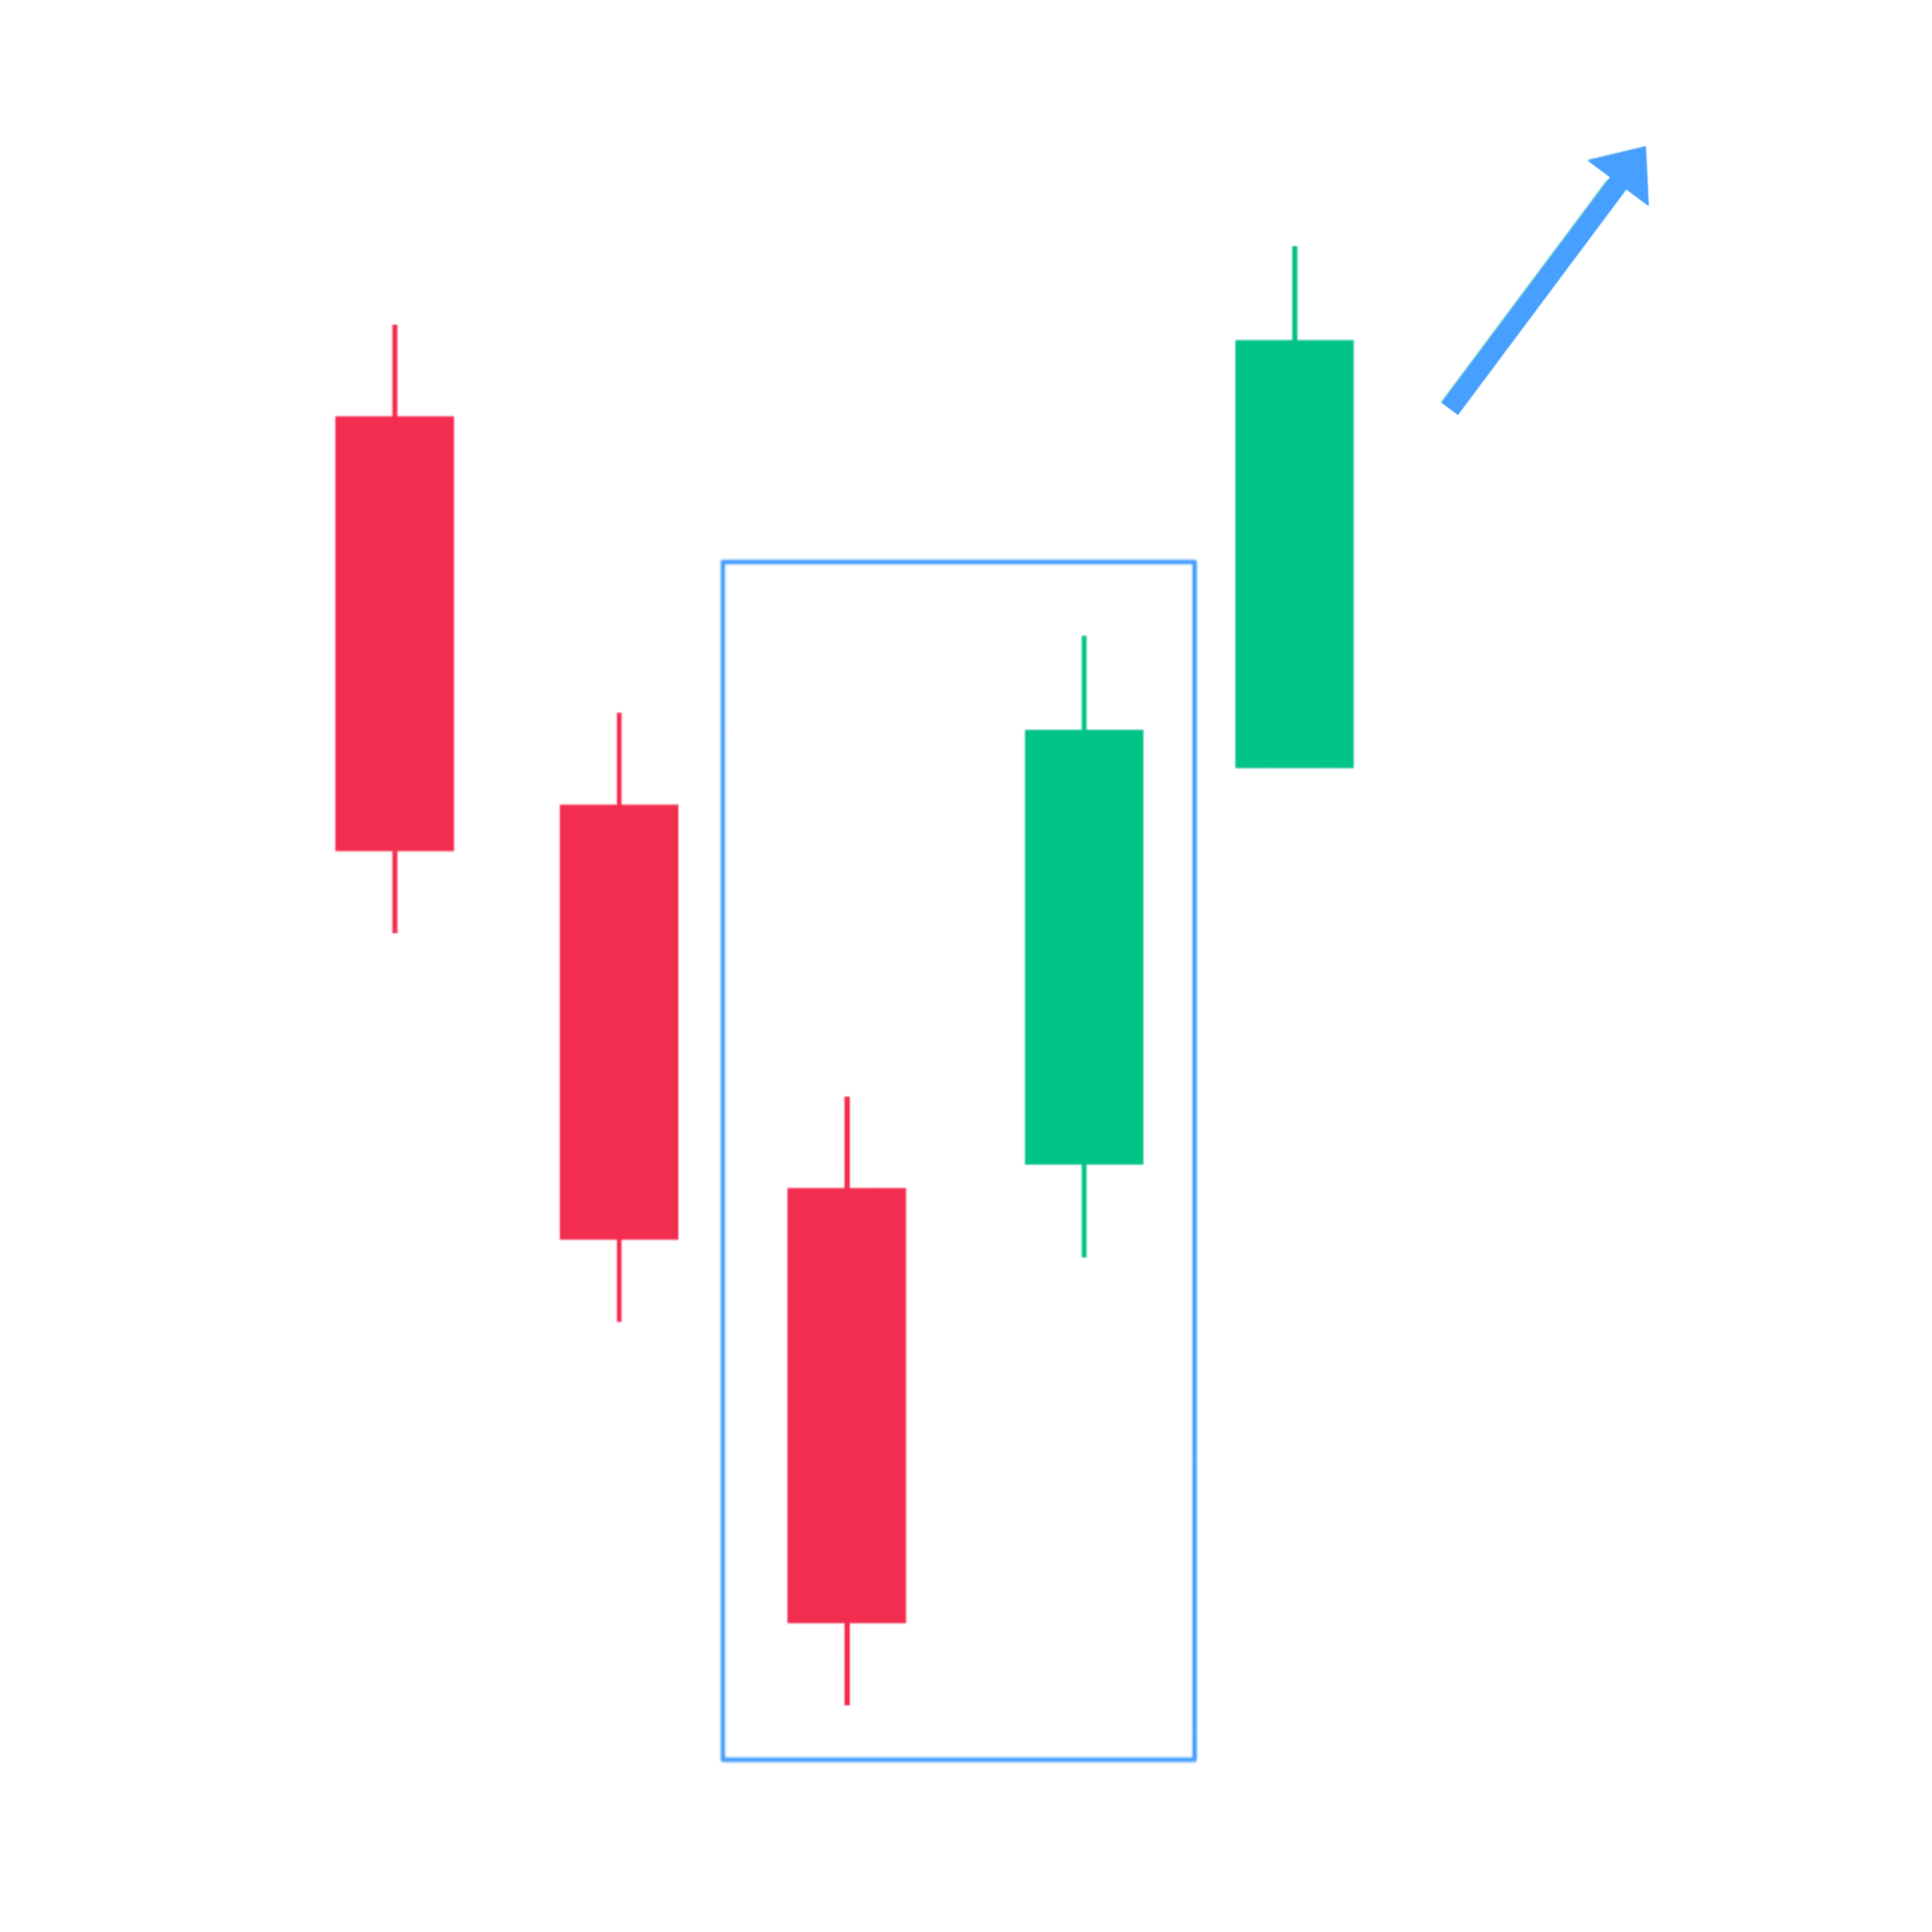
11. Three Inside Up

“Three inside up is a three-candlestick bullish reversal candlestick pattern, The first candlestick is long and bearish, indicating that the market is still in a downtrend, The second candlestick is bullish and should ideally close at the halfway mark of the first candlestick / inside candle, and the third candlestick is also bullish and closes beyond the open of the first candle.
Most of the Traders can take a long position after the completion of this candlestick pattern.
The relation of the first and second candlestick should be of the bullish harami or a inside baby candle.
Guide: Traders prefer to wait for confirmation by entering only if the price moves above the high of the third candle and place a stop-loss order below the low of the second/first candle in the pattern.
12. Three Outside Up
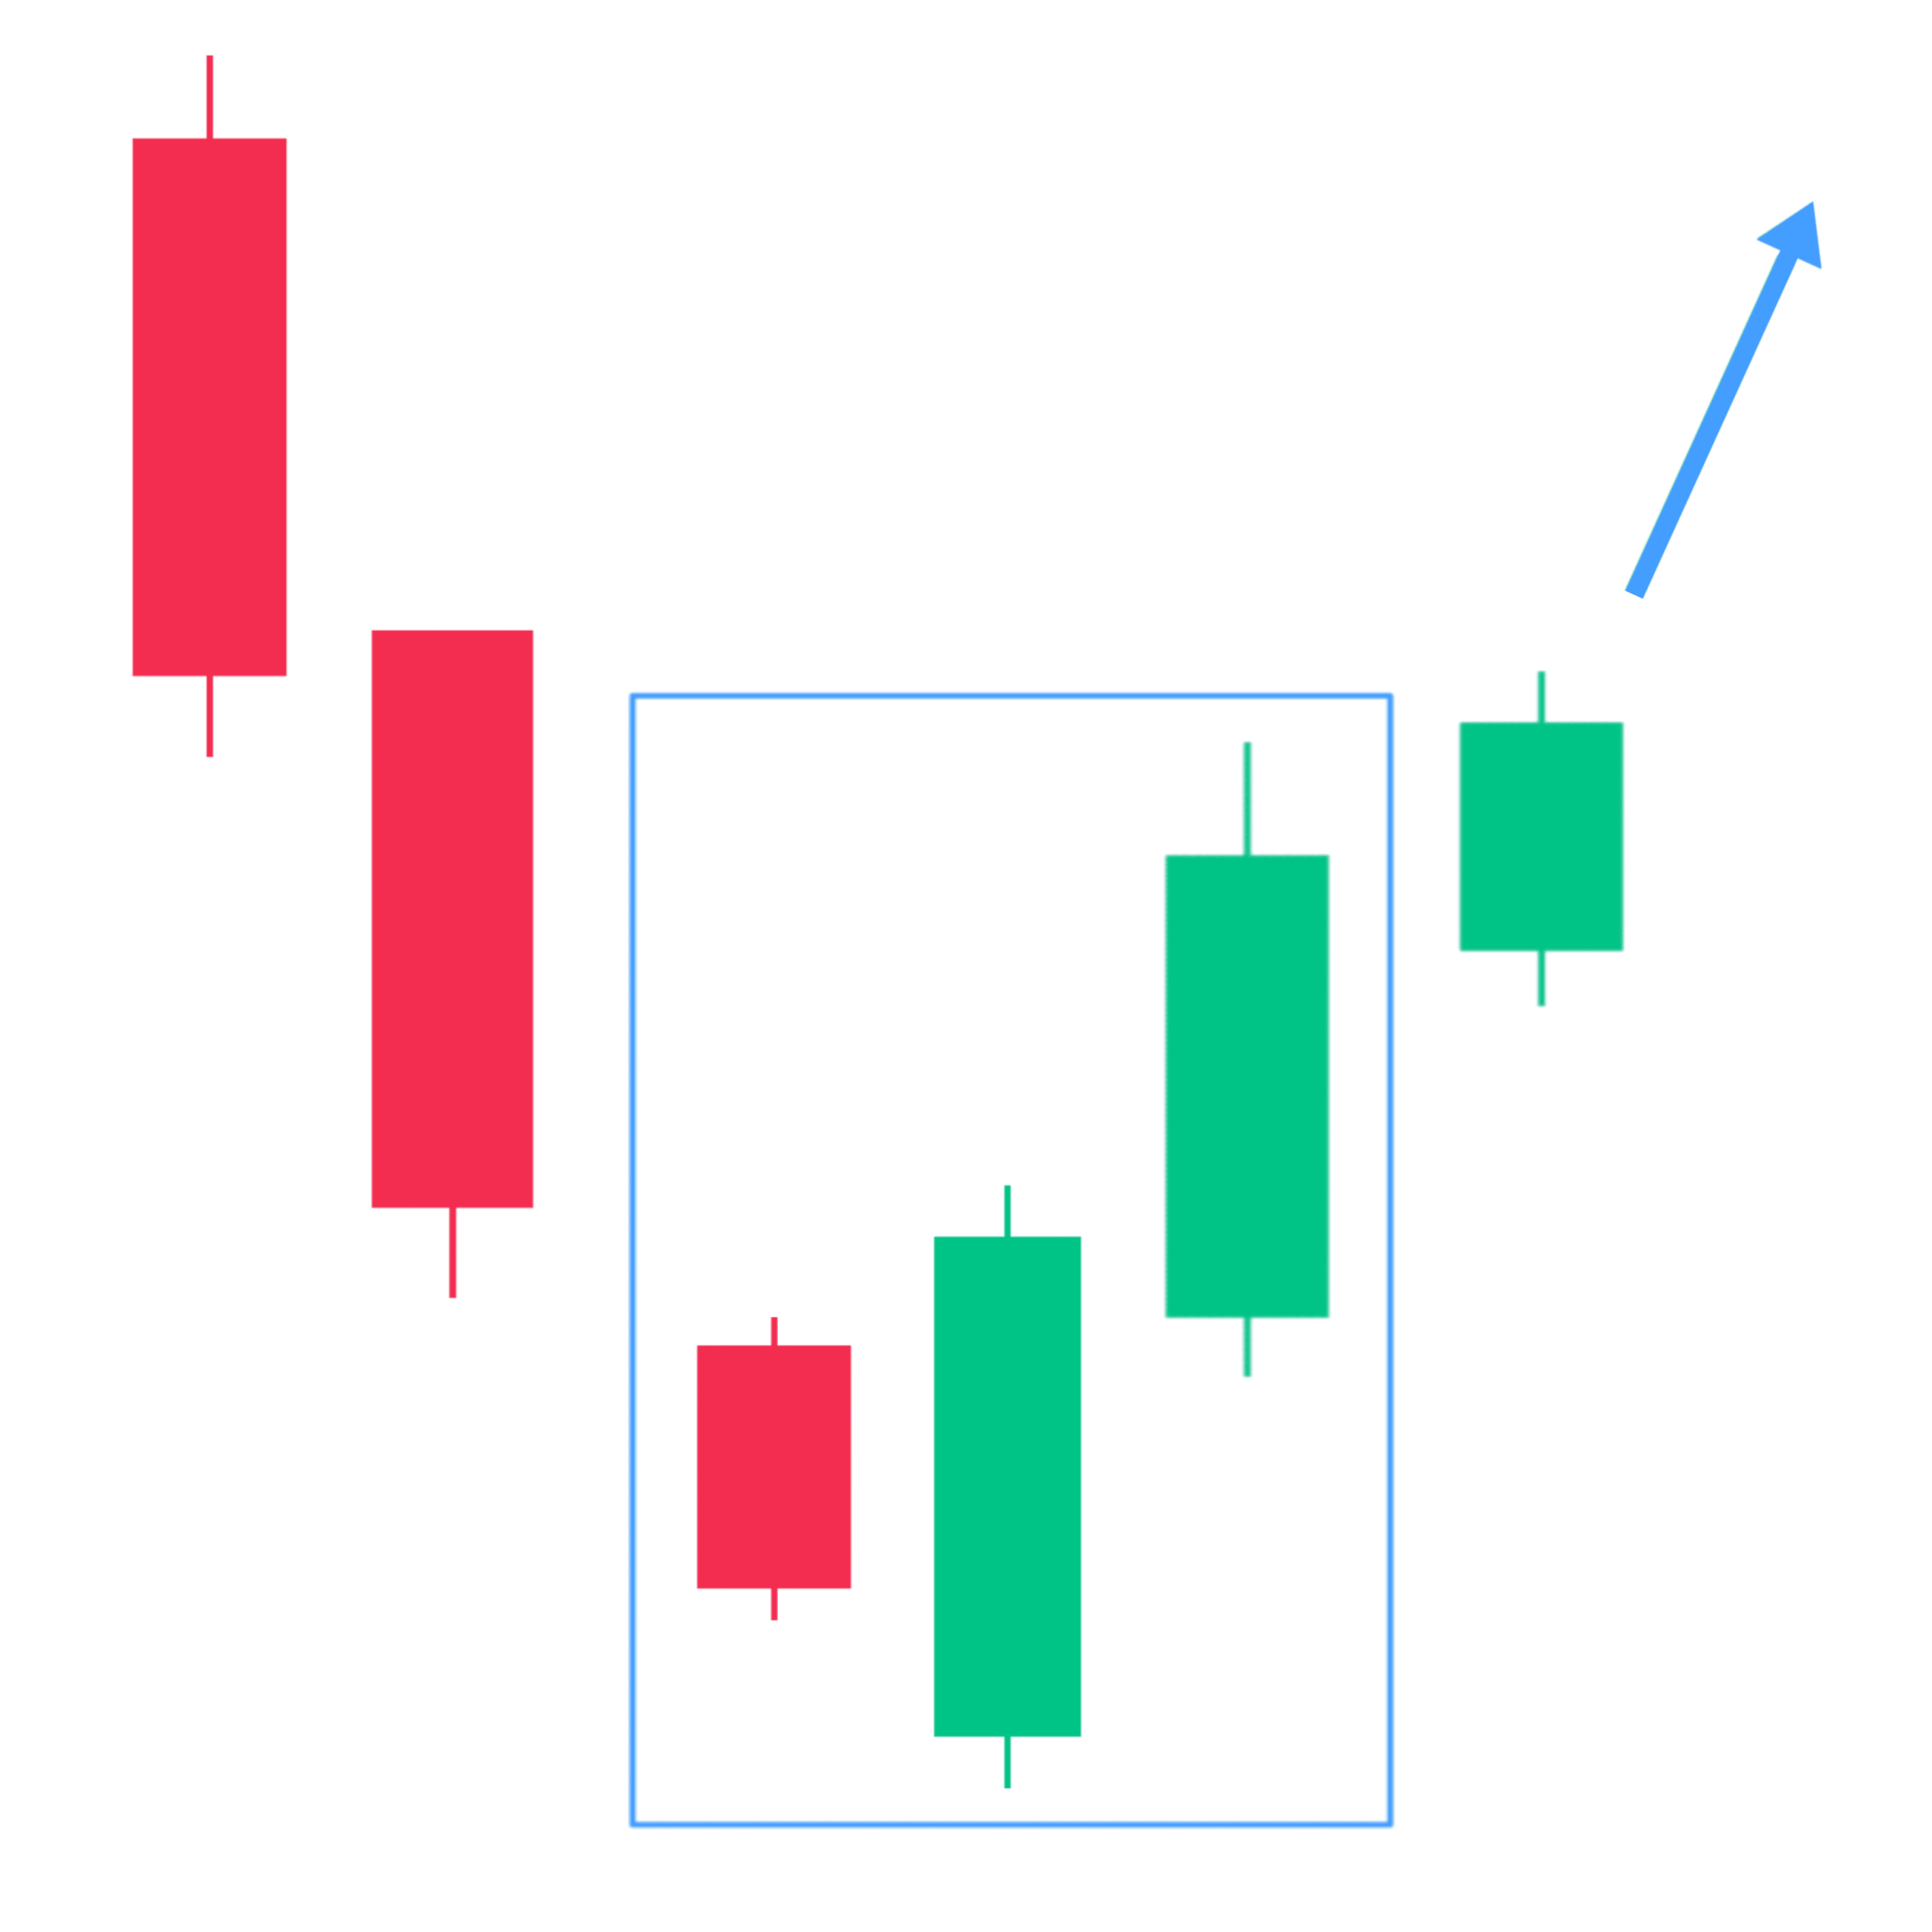
The “three outside up” is another bullish candlestick pattern that signals a potential reversal after a downtrend indicating bullish reversal.
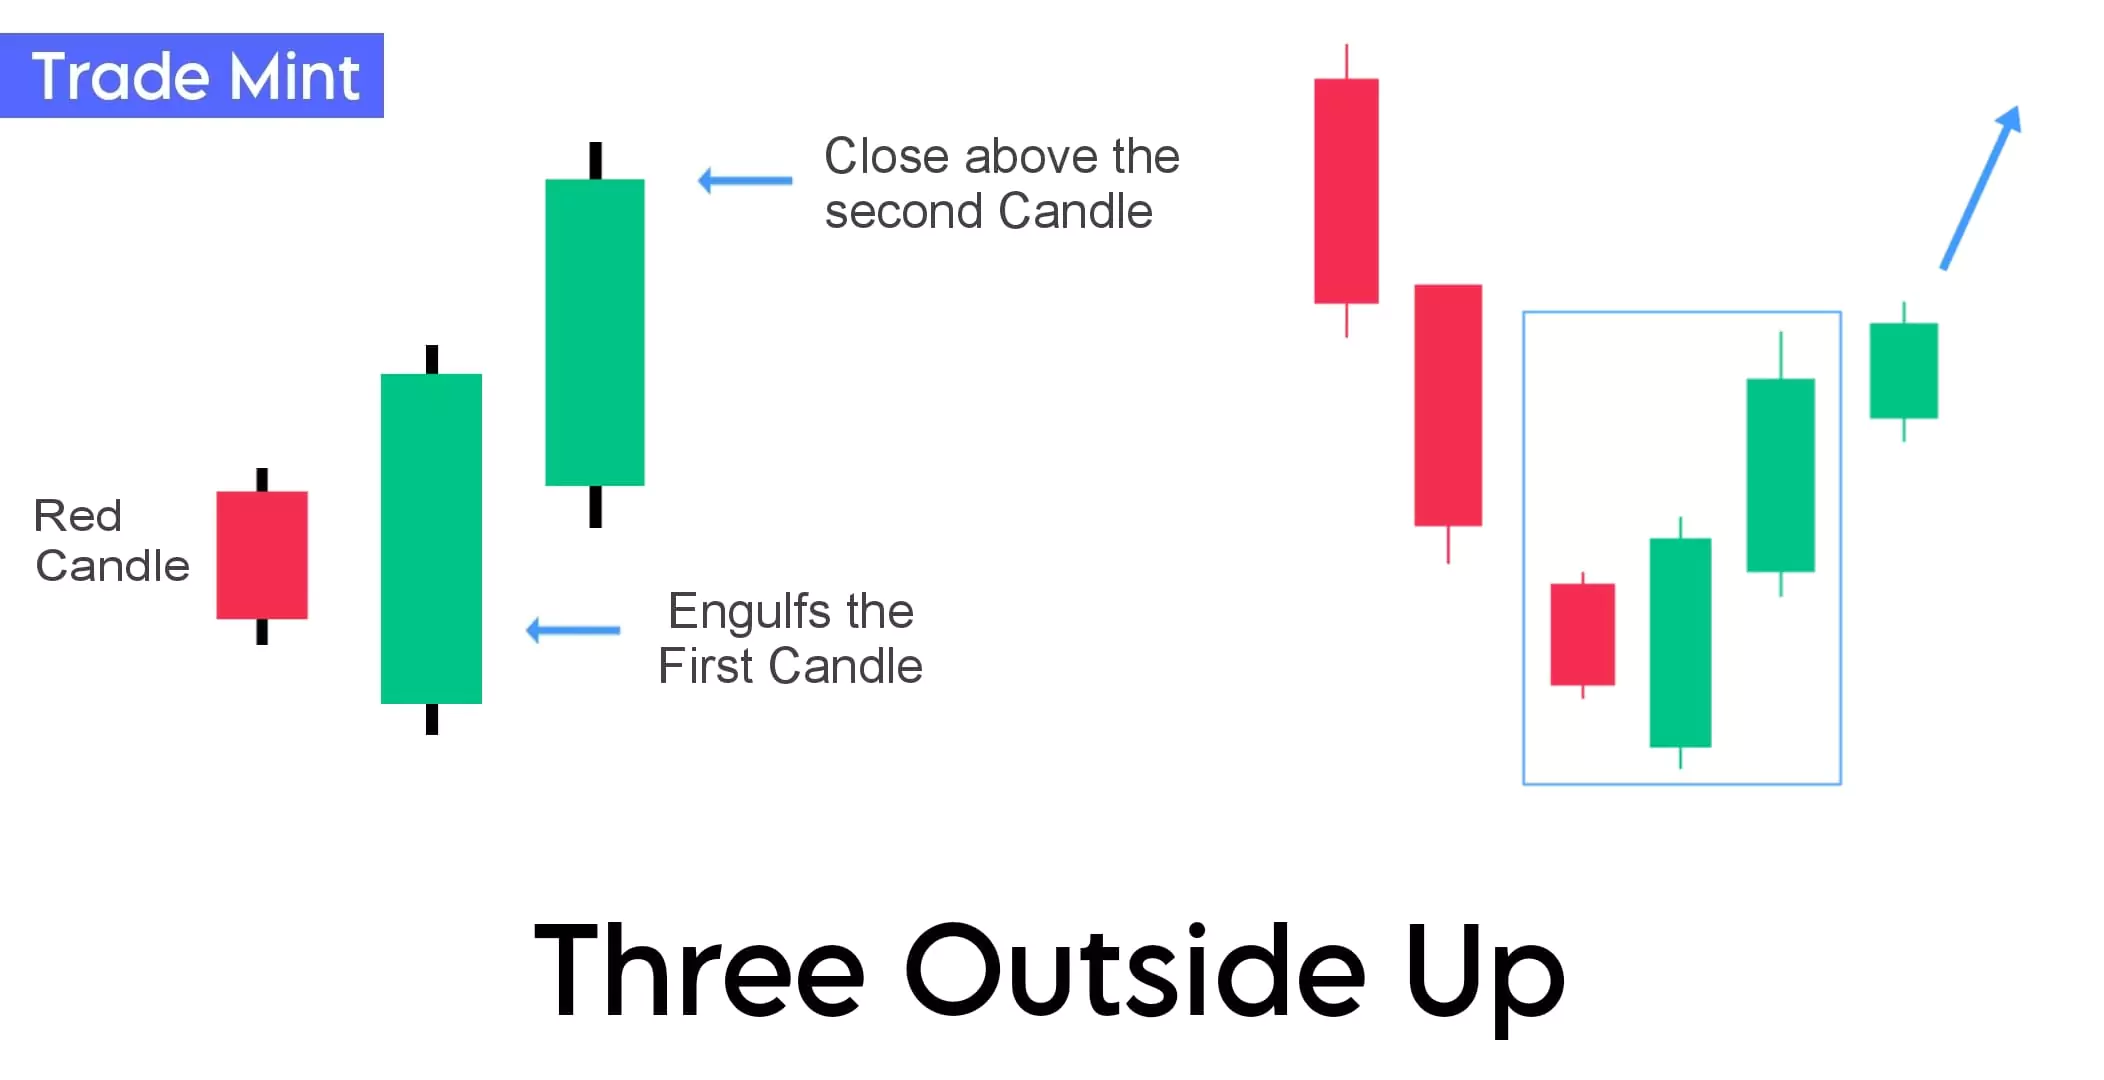
Three outside up is a little bit similar to the three inside up, the pattern starts with a small-bodied bearish candle, indicating a lossing momentum in the downtrend.
The second candle is a strong large bullish candle that is completely engulfed by the body of the first candle. This confirms a potential weakening of the bearish momentum.
The third candle is a bullish candle that closes higher than the high of the second candle and confirms the potential reversal and indicates that bullish momentum has taken control.
The above pattern gives you a let entry so you can refer, Bullish Engulfing for early entry and it is stronger than the three outside up candlestick pattern.
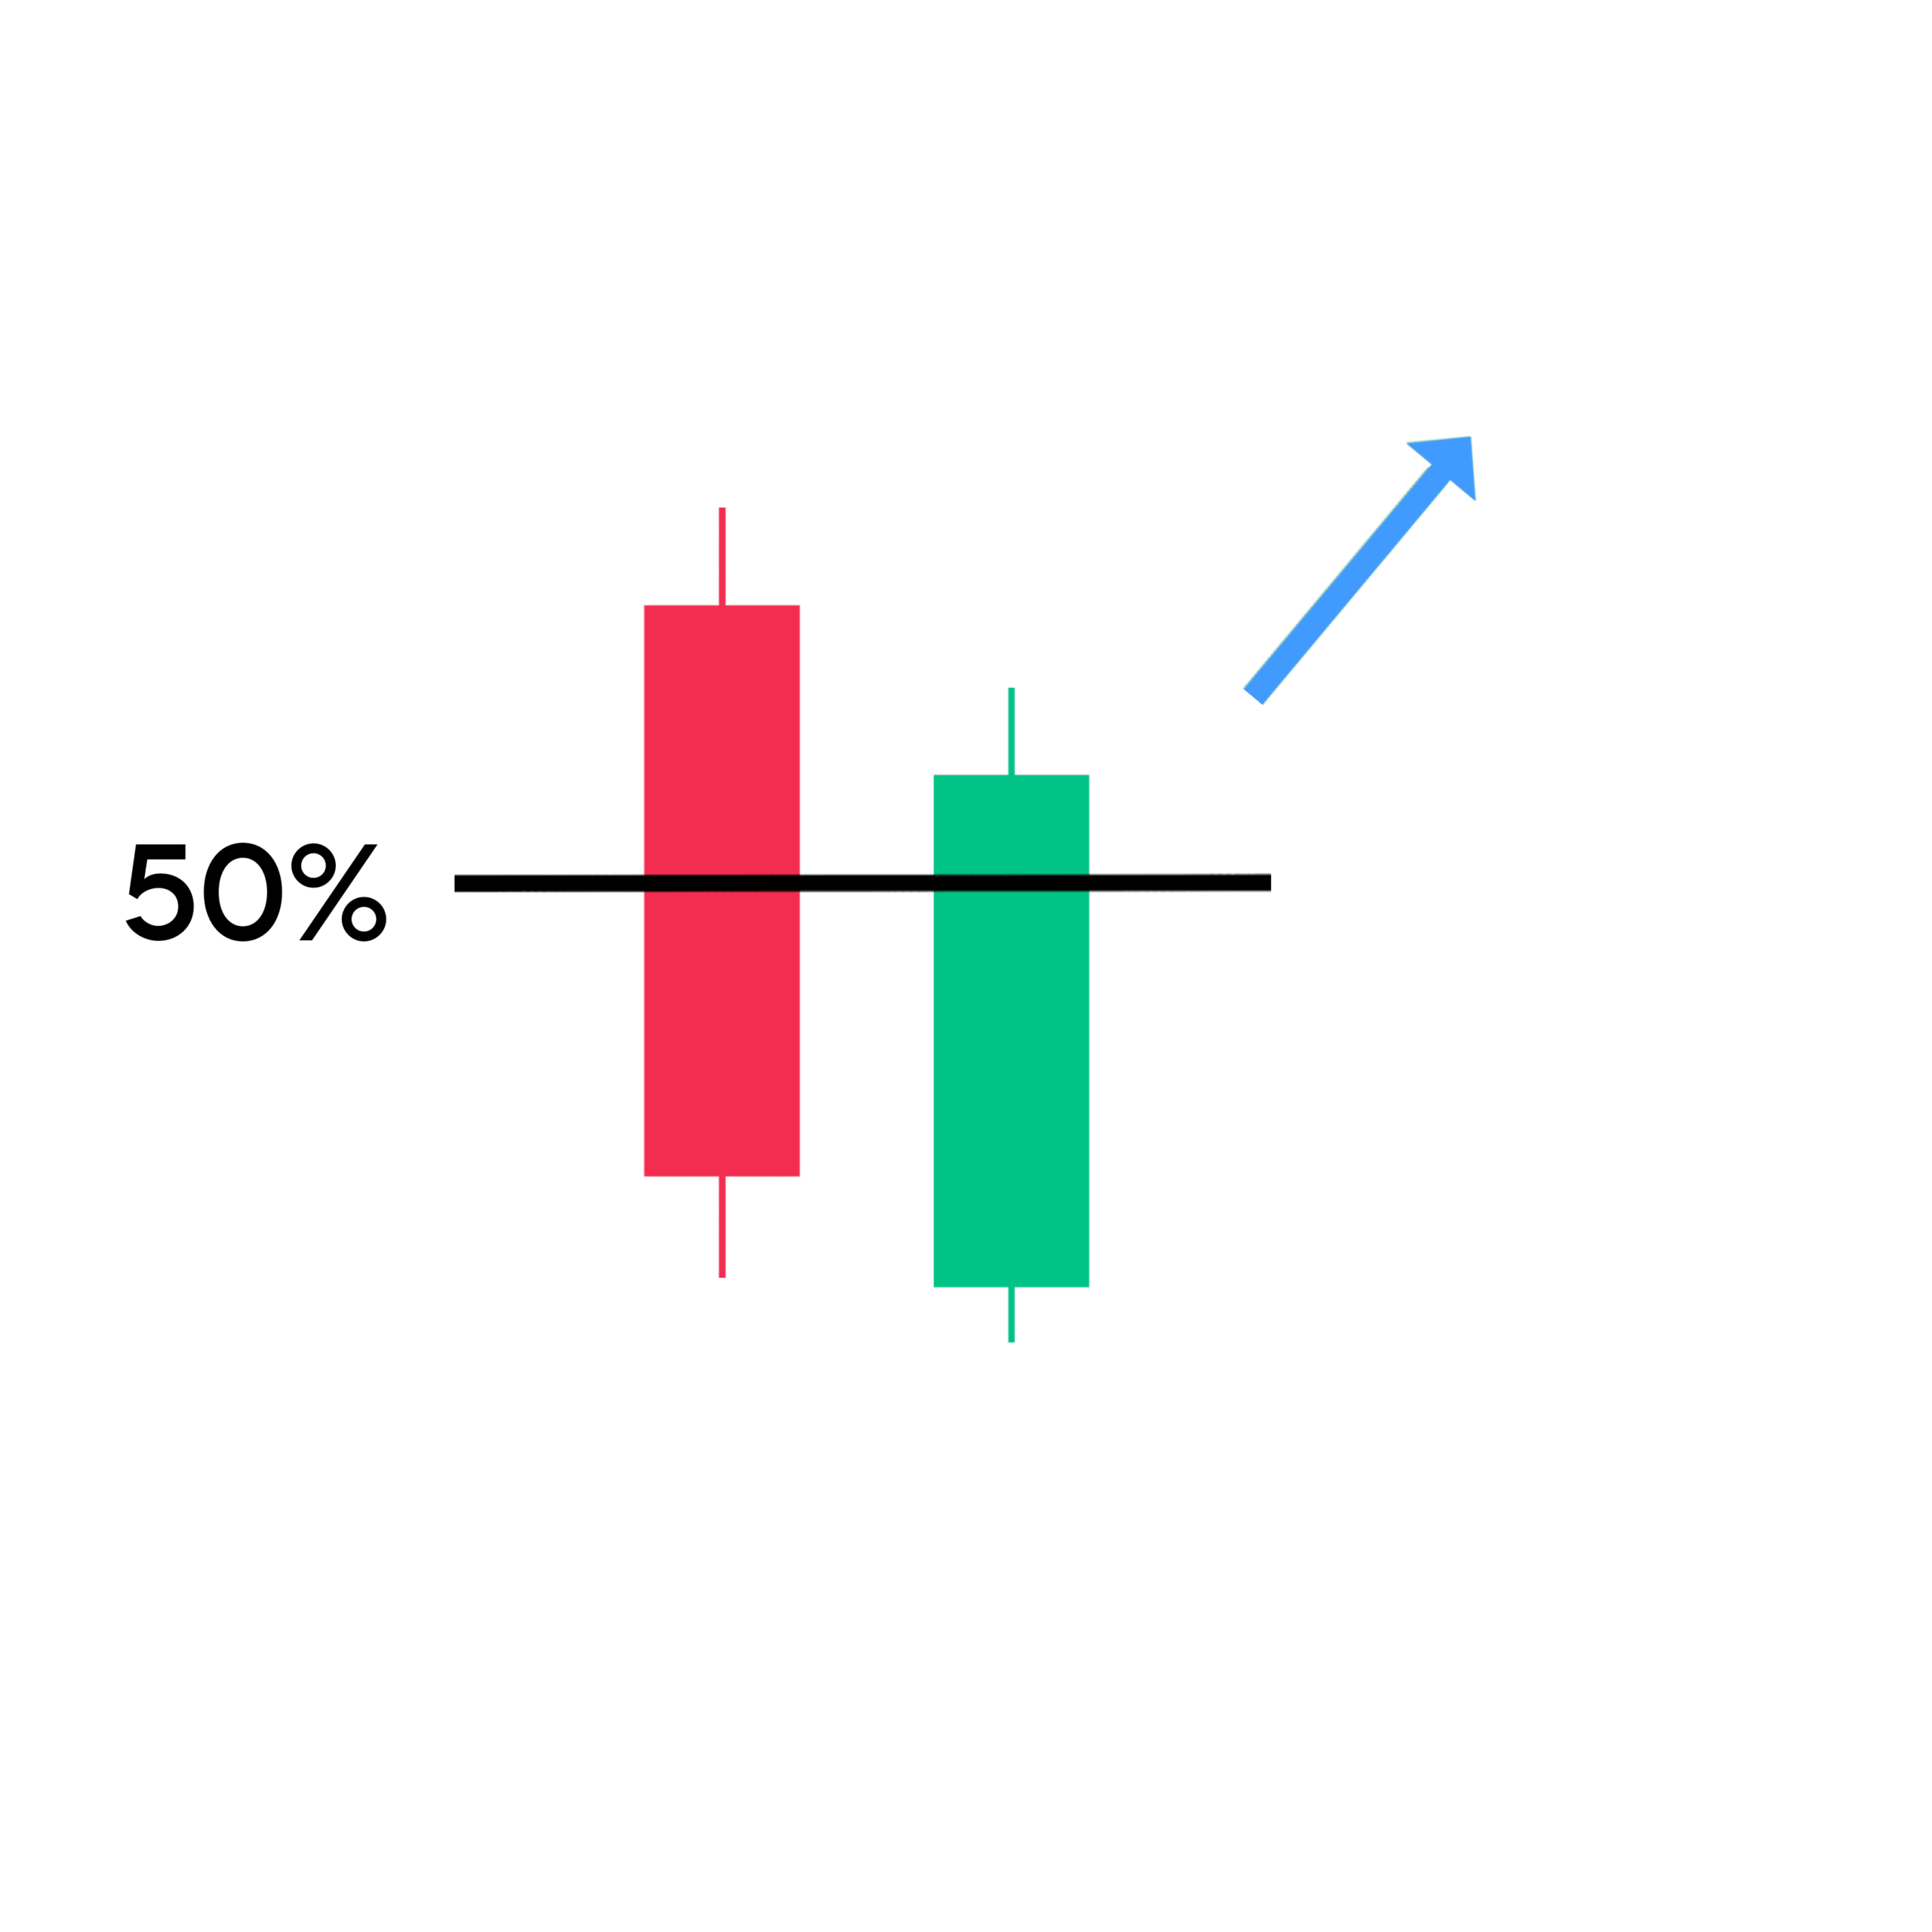
13. Pricing Line
This is a two-candle pattern containing a long red candle followed by a long green candle. Also, the closing price of the second candle must be more than halfway up the body of the first green candle. This indicates strong buying pressure just you can see the below image,
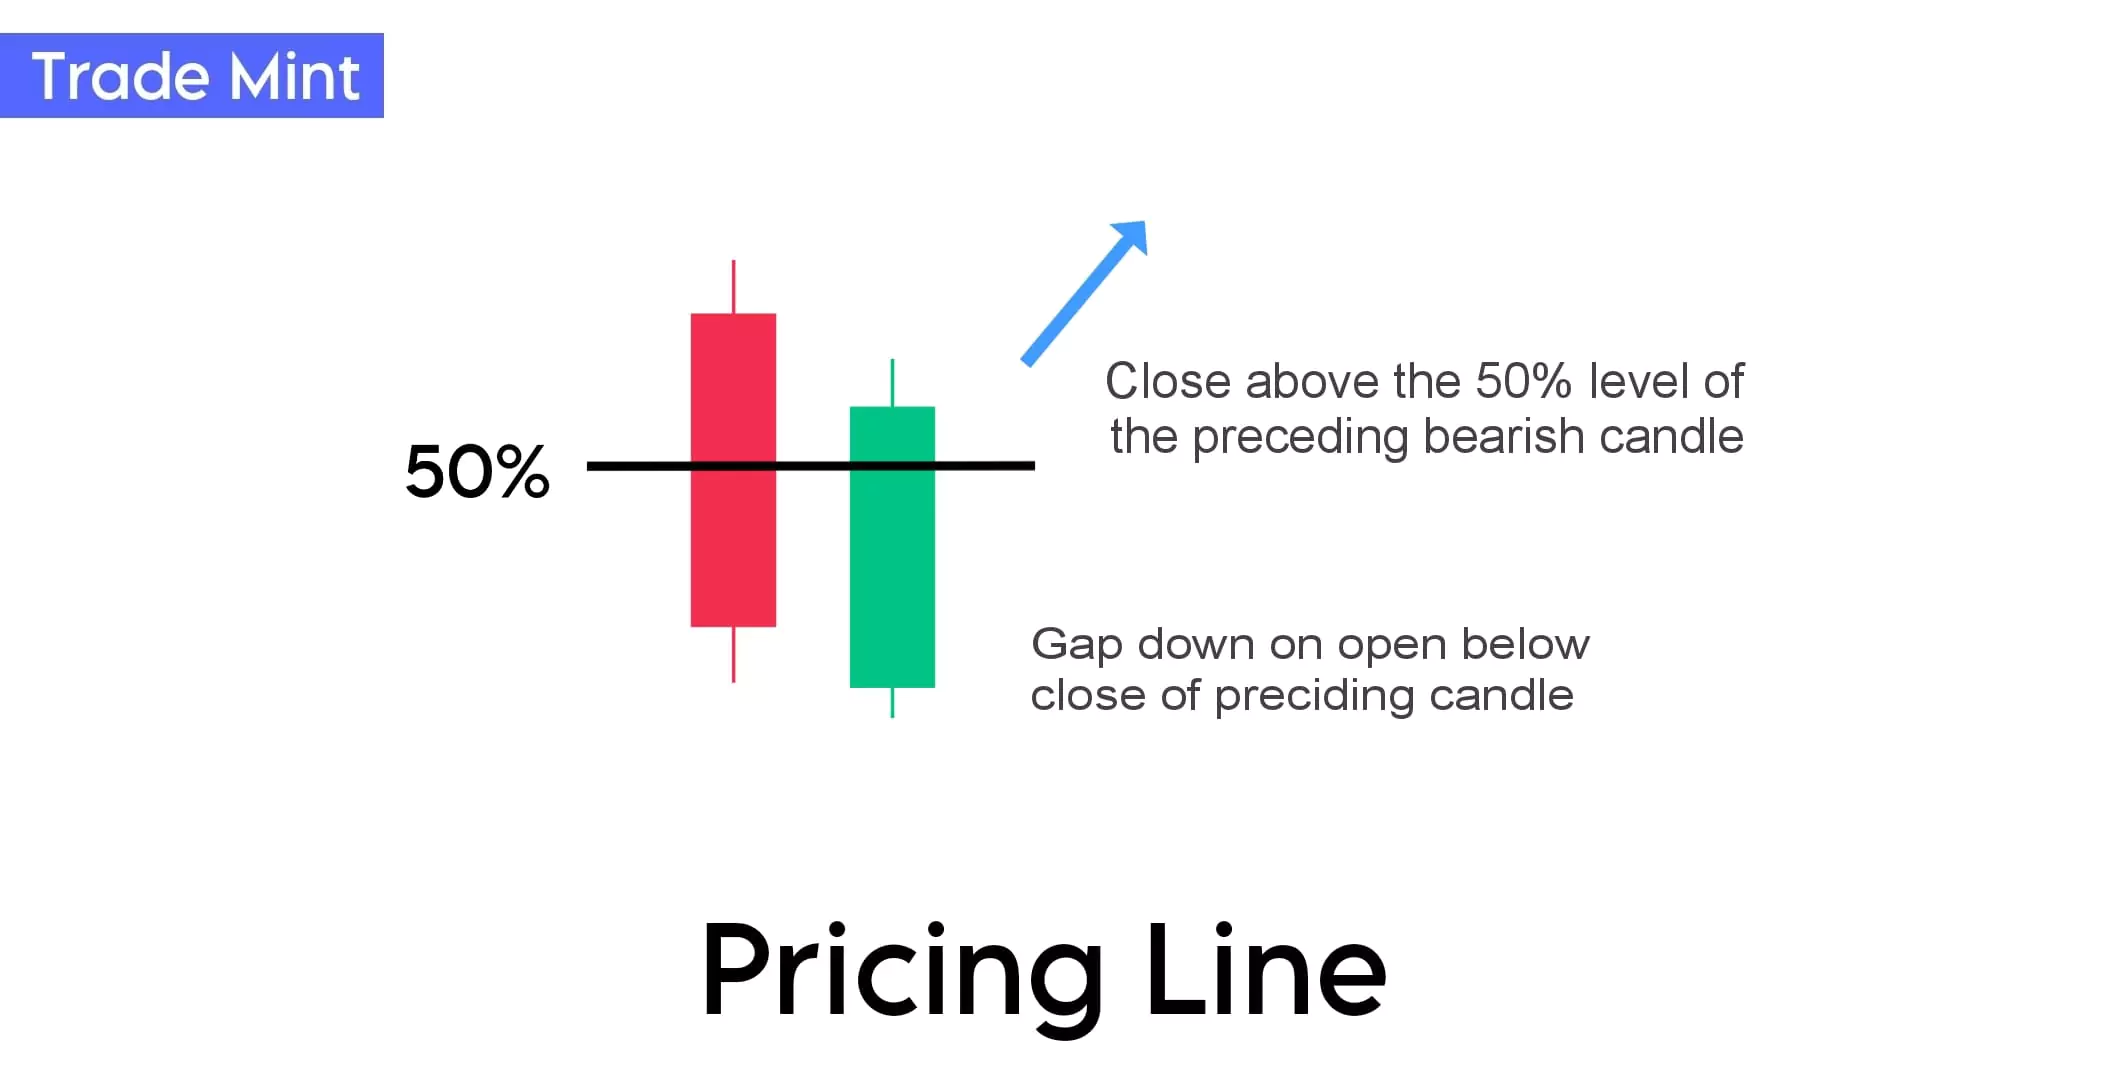
there’s a significant gap between the red candle’s closing price and the green candle’s open price and both are opposite to each other.
14. Bullish Kicker
The bullish kicker is a two-candle pattern that signifies a strong and sudden reversal and shows a strong bullish reversal in the bottom of the downtrend.
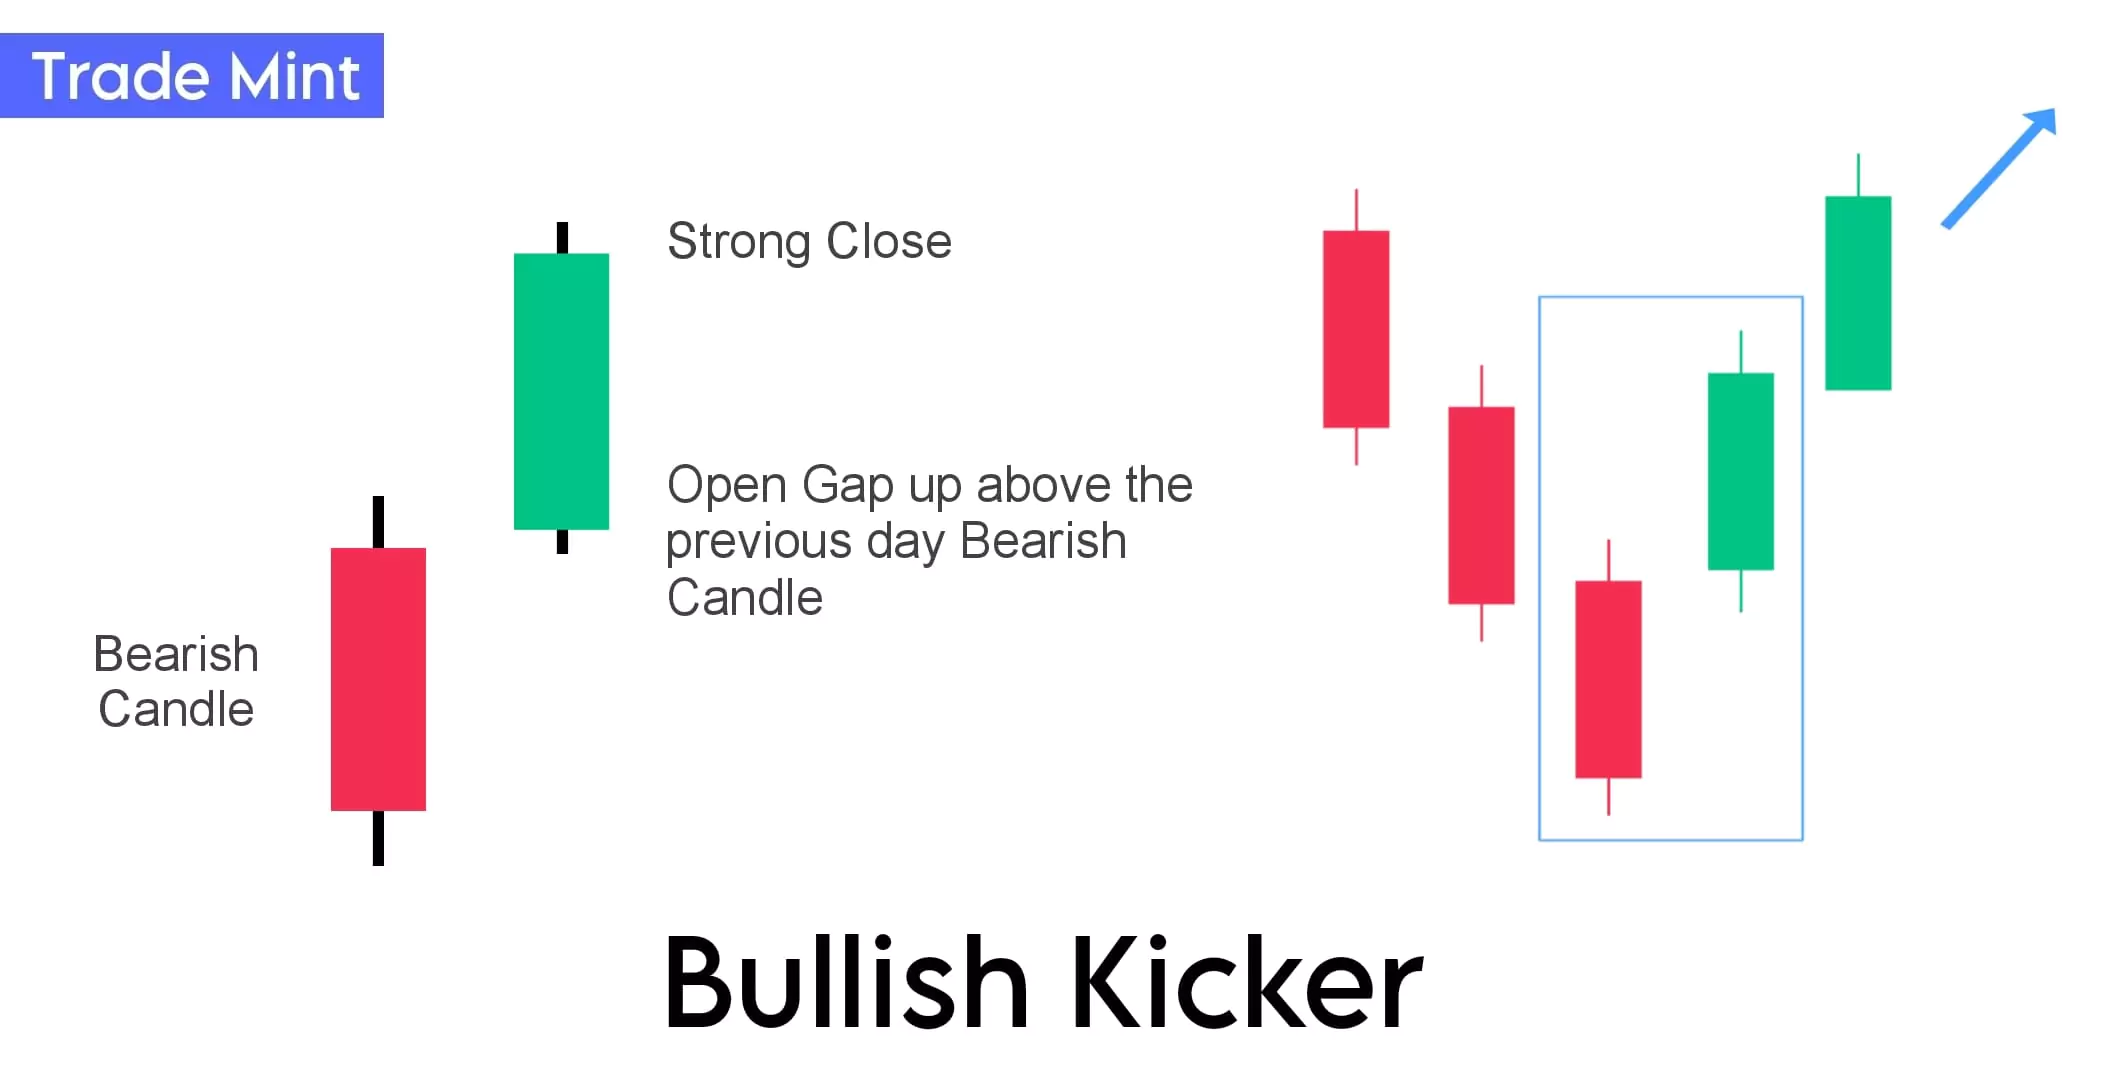
The key point of a bullish kicker pattern is the unexpected gap up above the close of the previous candle indicating strong bullish momentum and bulls are create and close the large size of the second bullish candle.
When considering entry and stop-loss for trading the bullish kicker pattern, traders may enter a long position at the opening of the third candle, and set a stop-loss below the low of the first candle.
Moreover, If the second candle is huge and long, it can practically close the door for you to open a new trade.
15. Spinning Top / Bottom
The spinning top / Bottom candlestick pattern is the same as the Doji pattern, indicating indecision in the market.
- In an uptrend, a Spinning Top may indicate a potential pause in the upward momentum.
- In a downtrend, it may signal a potential pause in the downward movement.
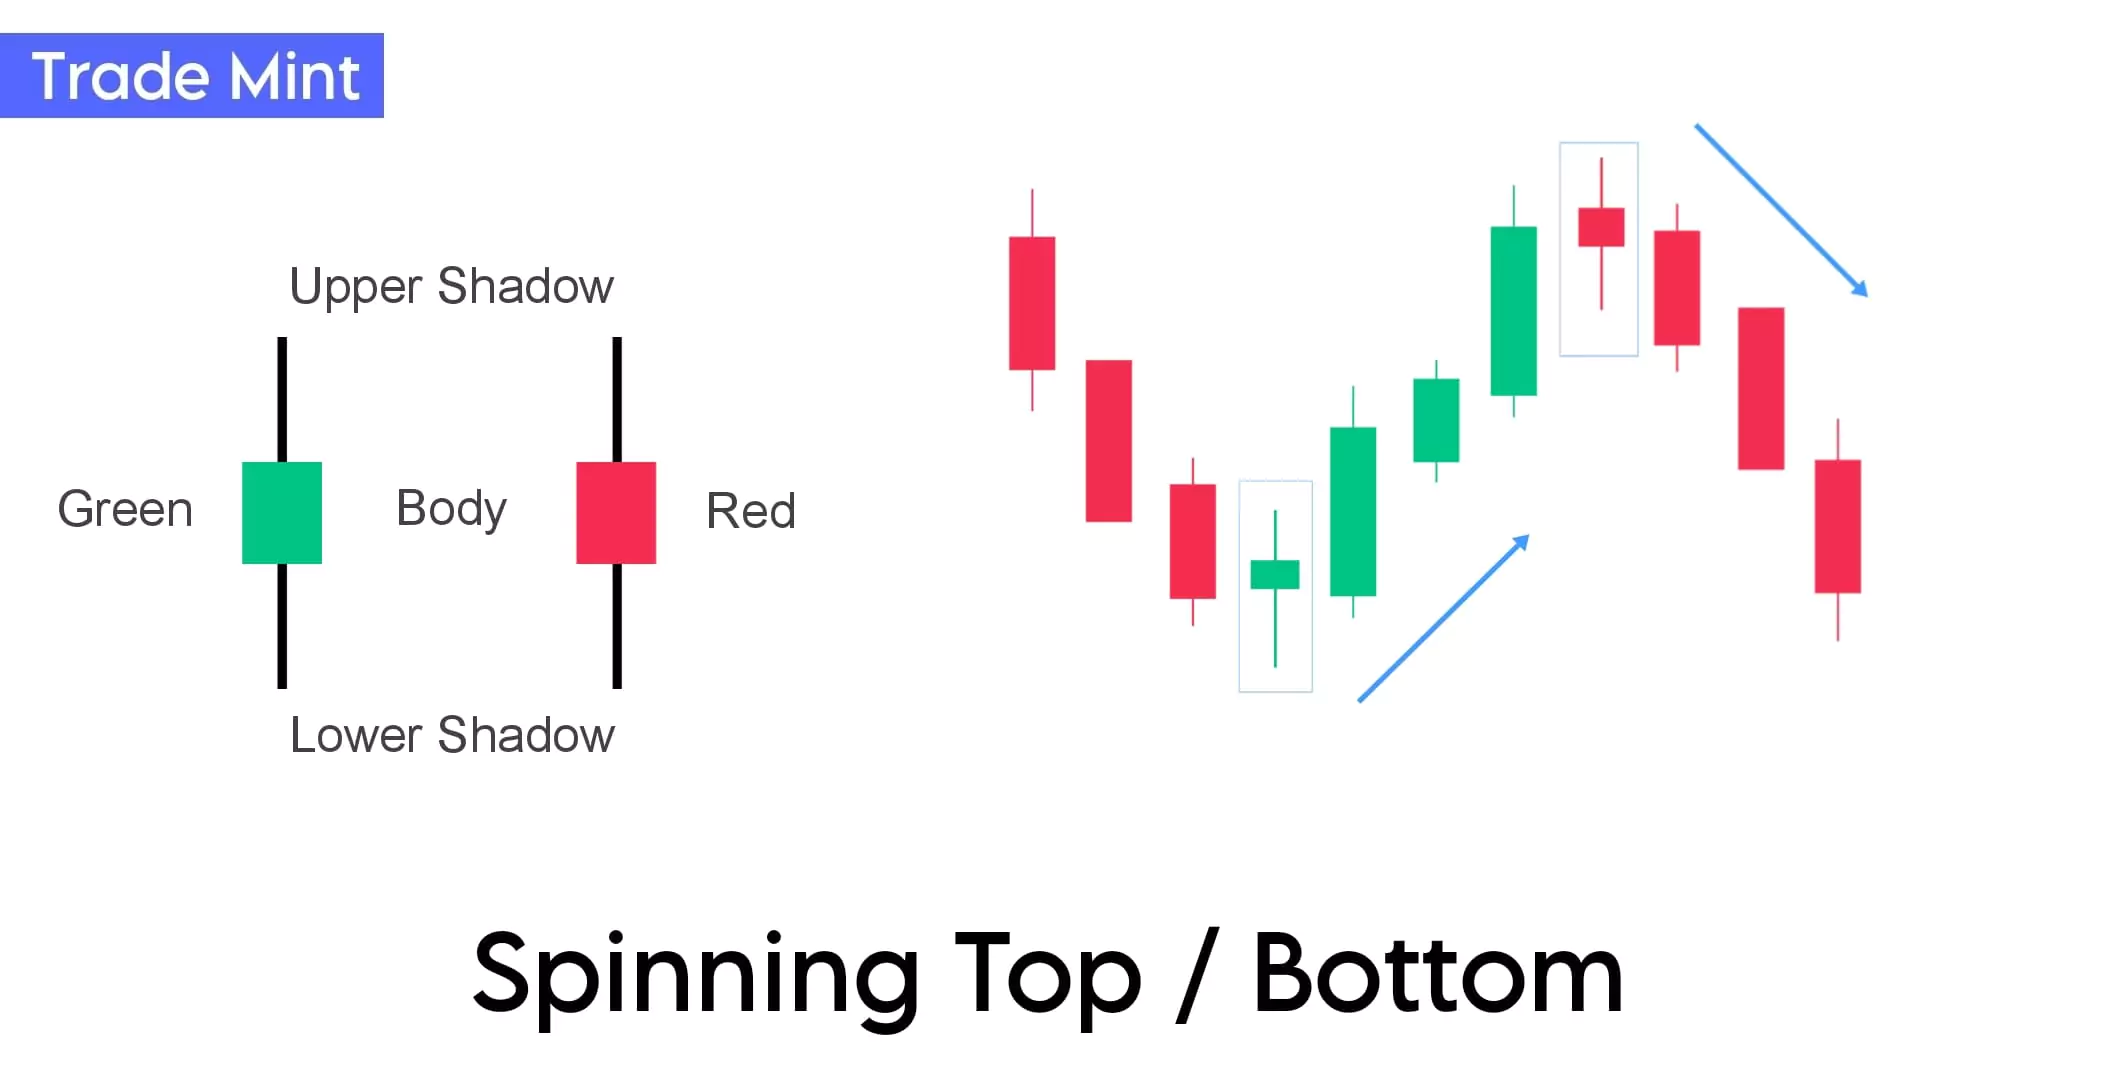
“The Spinning Top/Bottom is a single candle pattern that indicates indecision in the market. It forms when the open and close prices are very close to each other, resulting in a small real body (Red or Green). The high and low prices create long upper and lower shadows, forming a candlestick that looks like a spinning top.”
Market buyers try to push up prices, and at the same time, market sellers also try to push these prices on a downtrend. However, when both fail to sustain their momentum, it leads to a situation of status quo.
Guide: Here’s how to identify a Spinning Top:
- Body: Small body size, indicating a close proximity between the open and close prices.
- Shadows/Wick’s: long upper and lower shadows, suggesting that there is no buyer and seller holding price movement during the trading period.
A Spinning Bottom is a similar concept but occurs at the bottom of a downtrend while a spinning top occurs at the top, and these are potentially signaling a reversal.
Bearish Reversal Candlestick Patterns
Bearish candlestick patterns indicate a higher possibility of downward price movement. It typically suggests that Sellers control the market. In a bearish candlestick, the close price is lower than the open price, indicating that sellers were more dominant during the specified time frame. Bearish patterns show larger red bodies long higher wicks, and short or no upper wicks.
So, when you see a bearish candle pattern, it’s like the market saying, “Hey, the uptrend might be over, and a downtrend could be starting.”
Below are the different types of bearish reversal patterns:
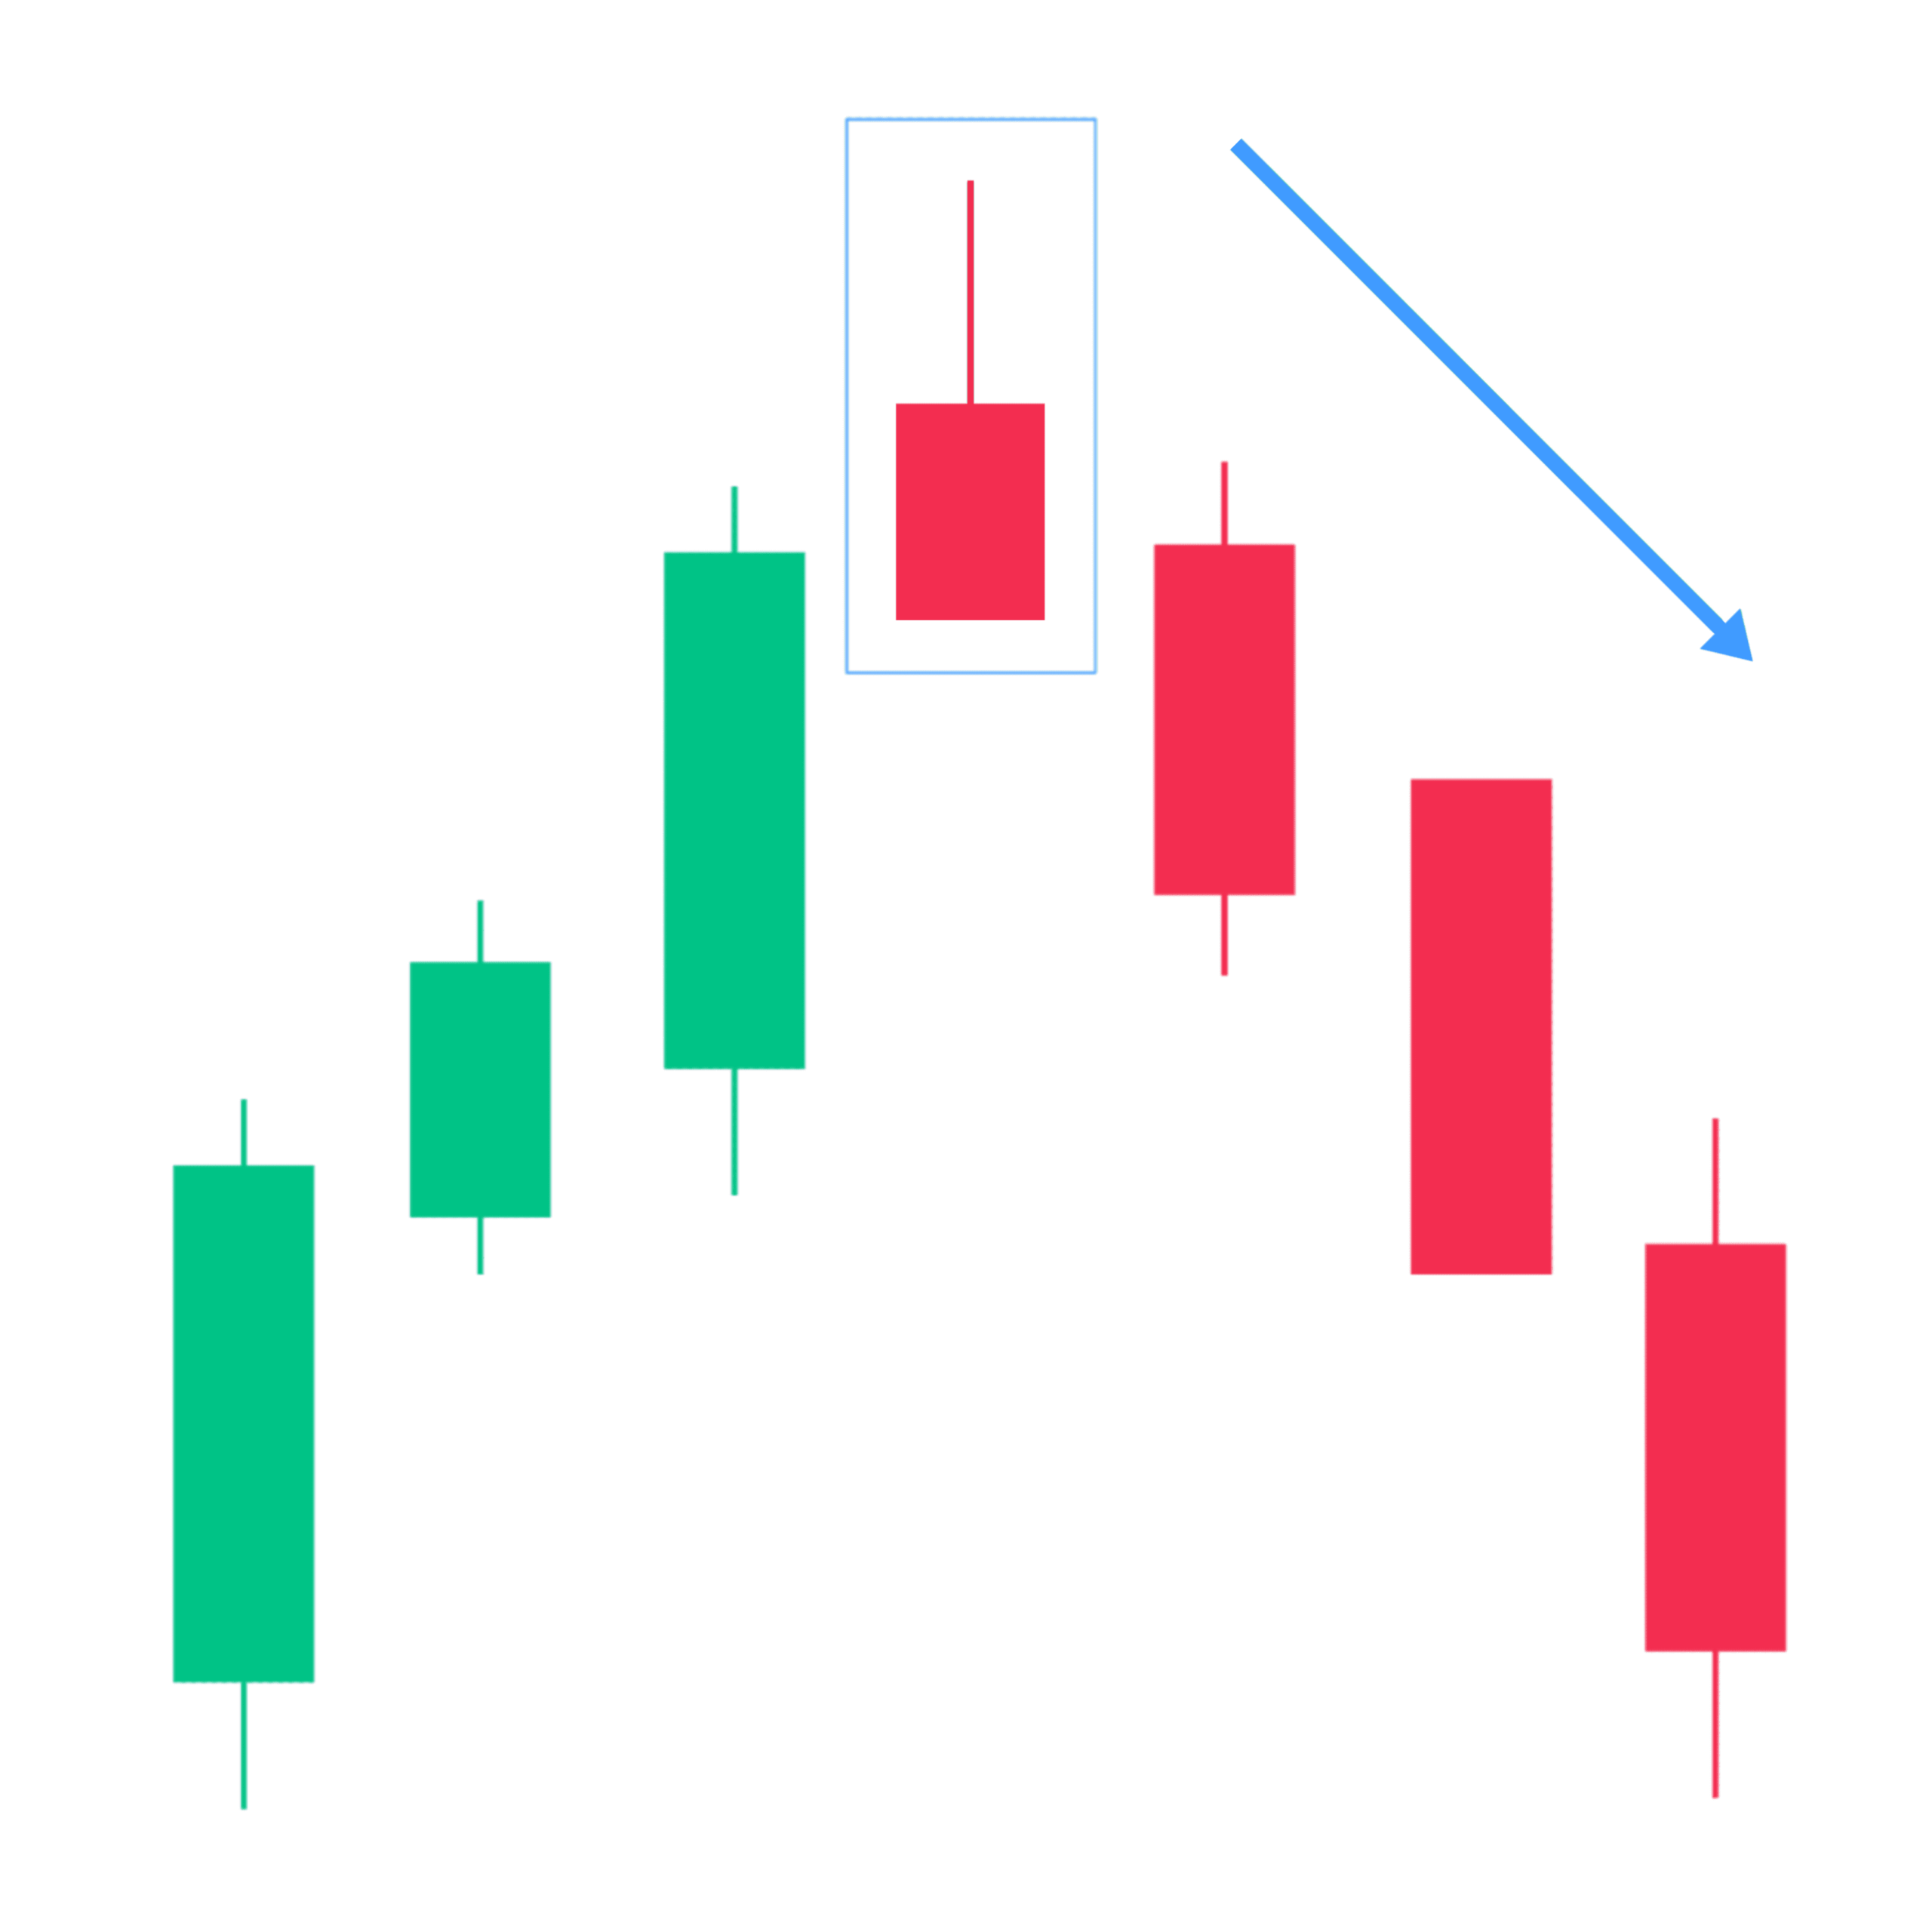
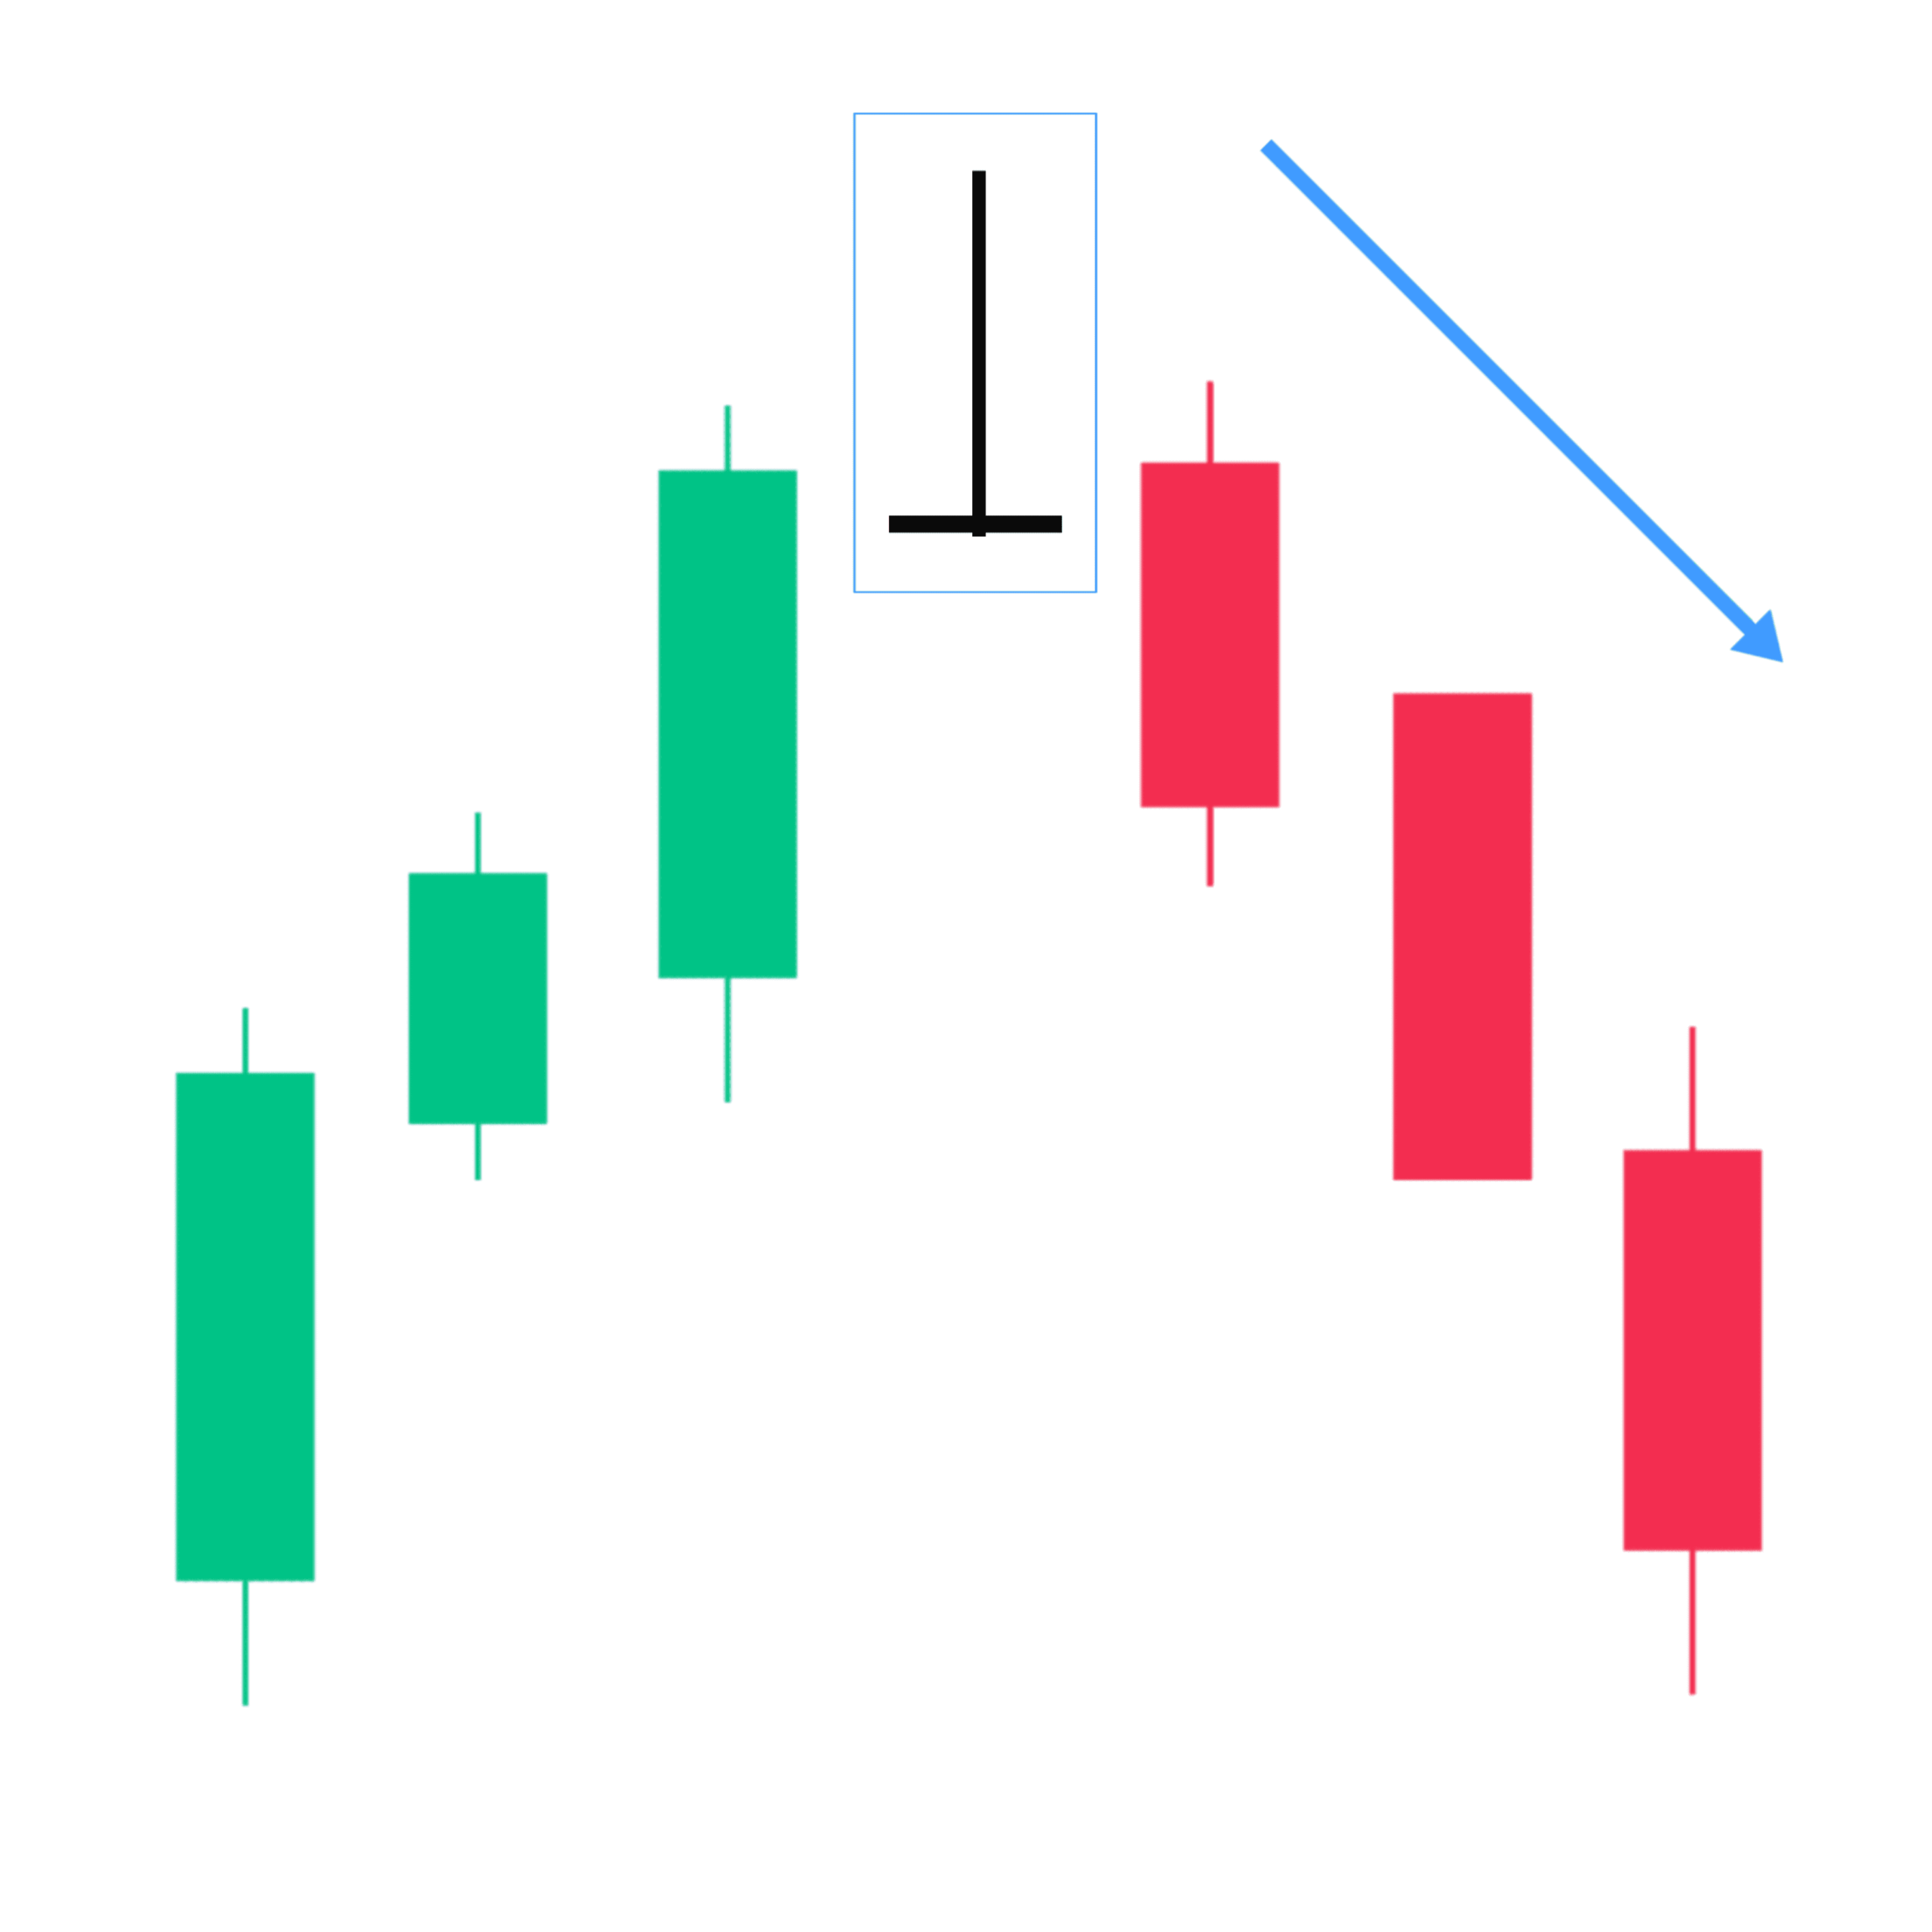
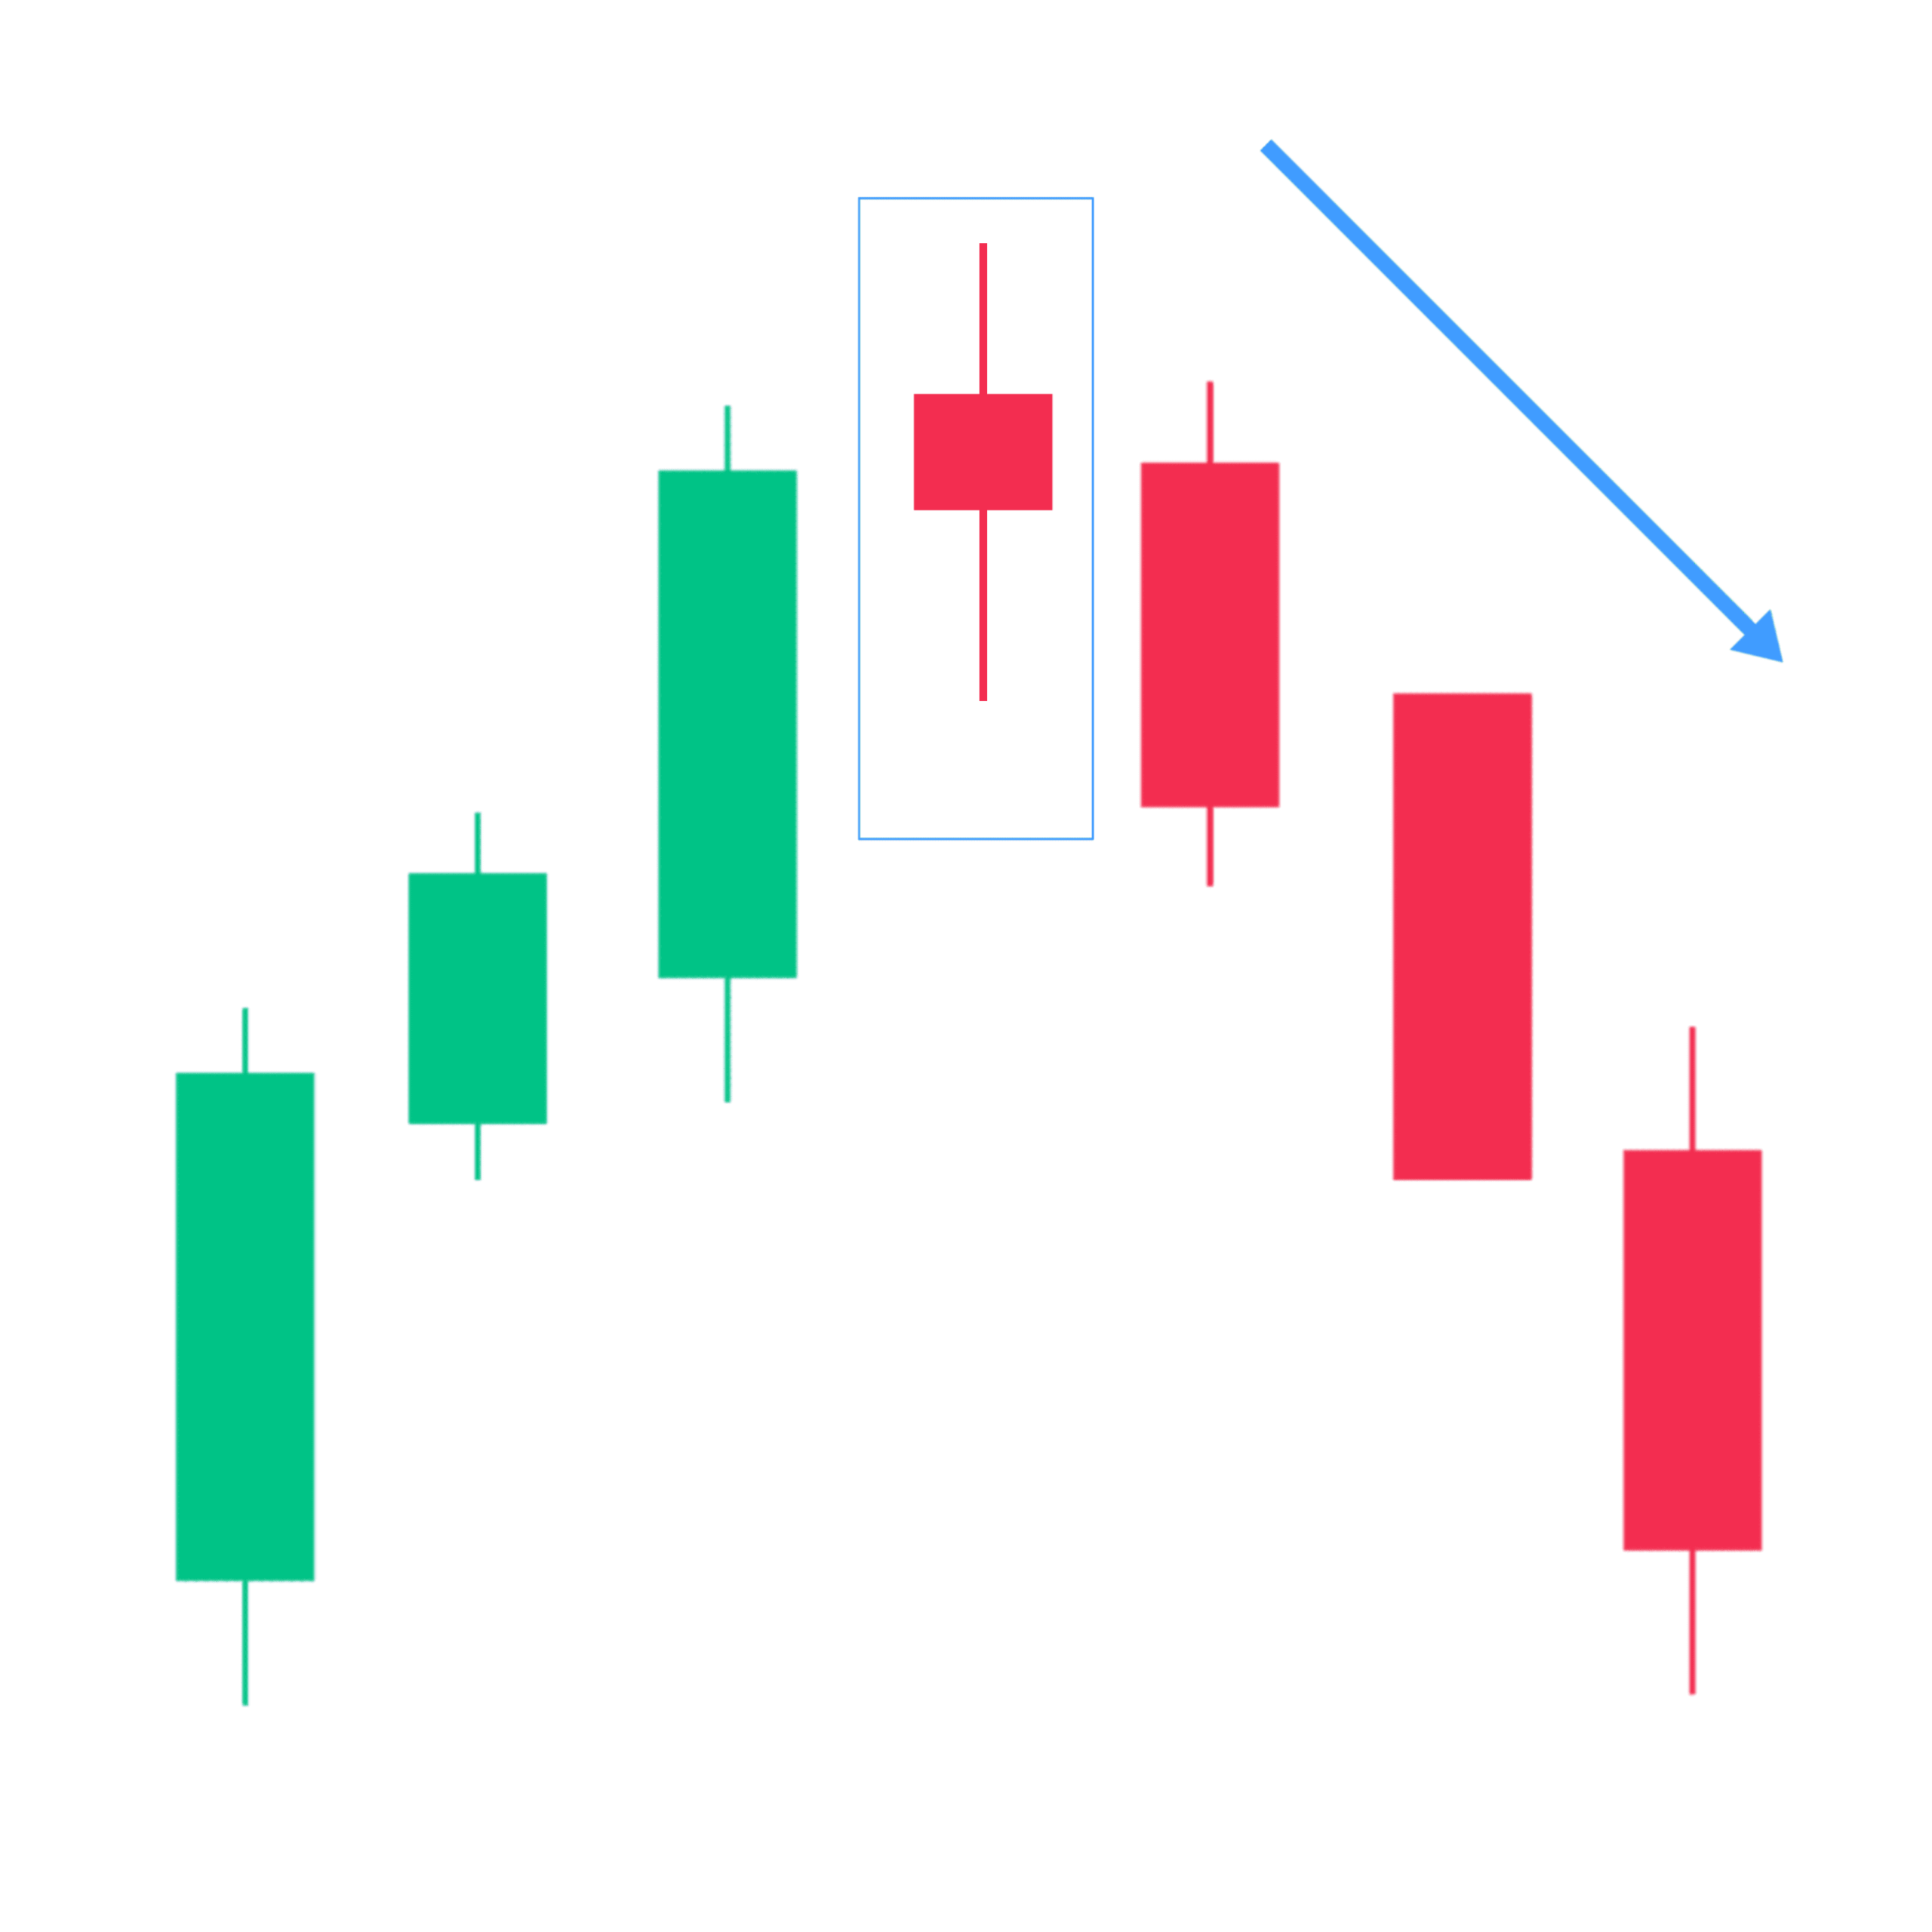
1. Shooting Star
A Shooting Star Candlestick is a bearish single Candlestick Pattern, Most traders use shooting star candlesticks in their trading as a strategy to identify potential selling opportunities, The shooting star is treated as a bearish reversal, but only when it appears under certain conditions.
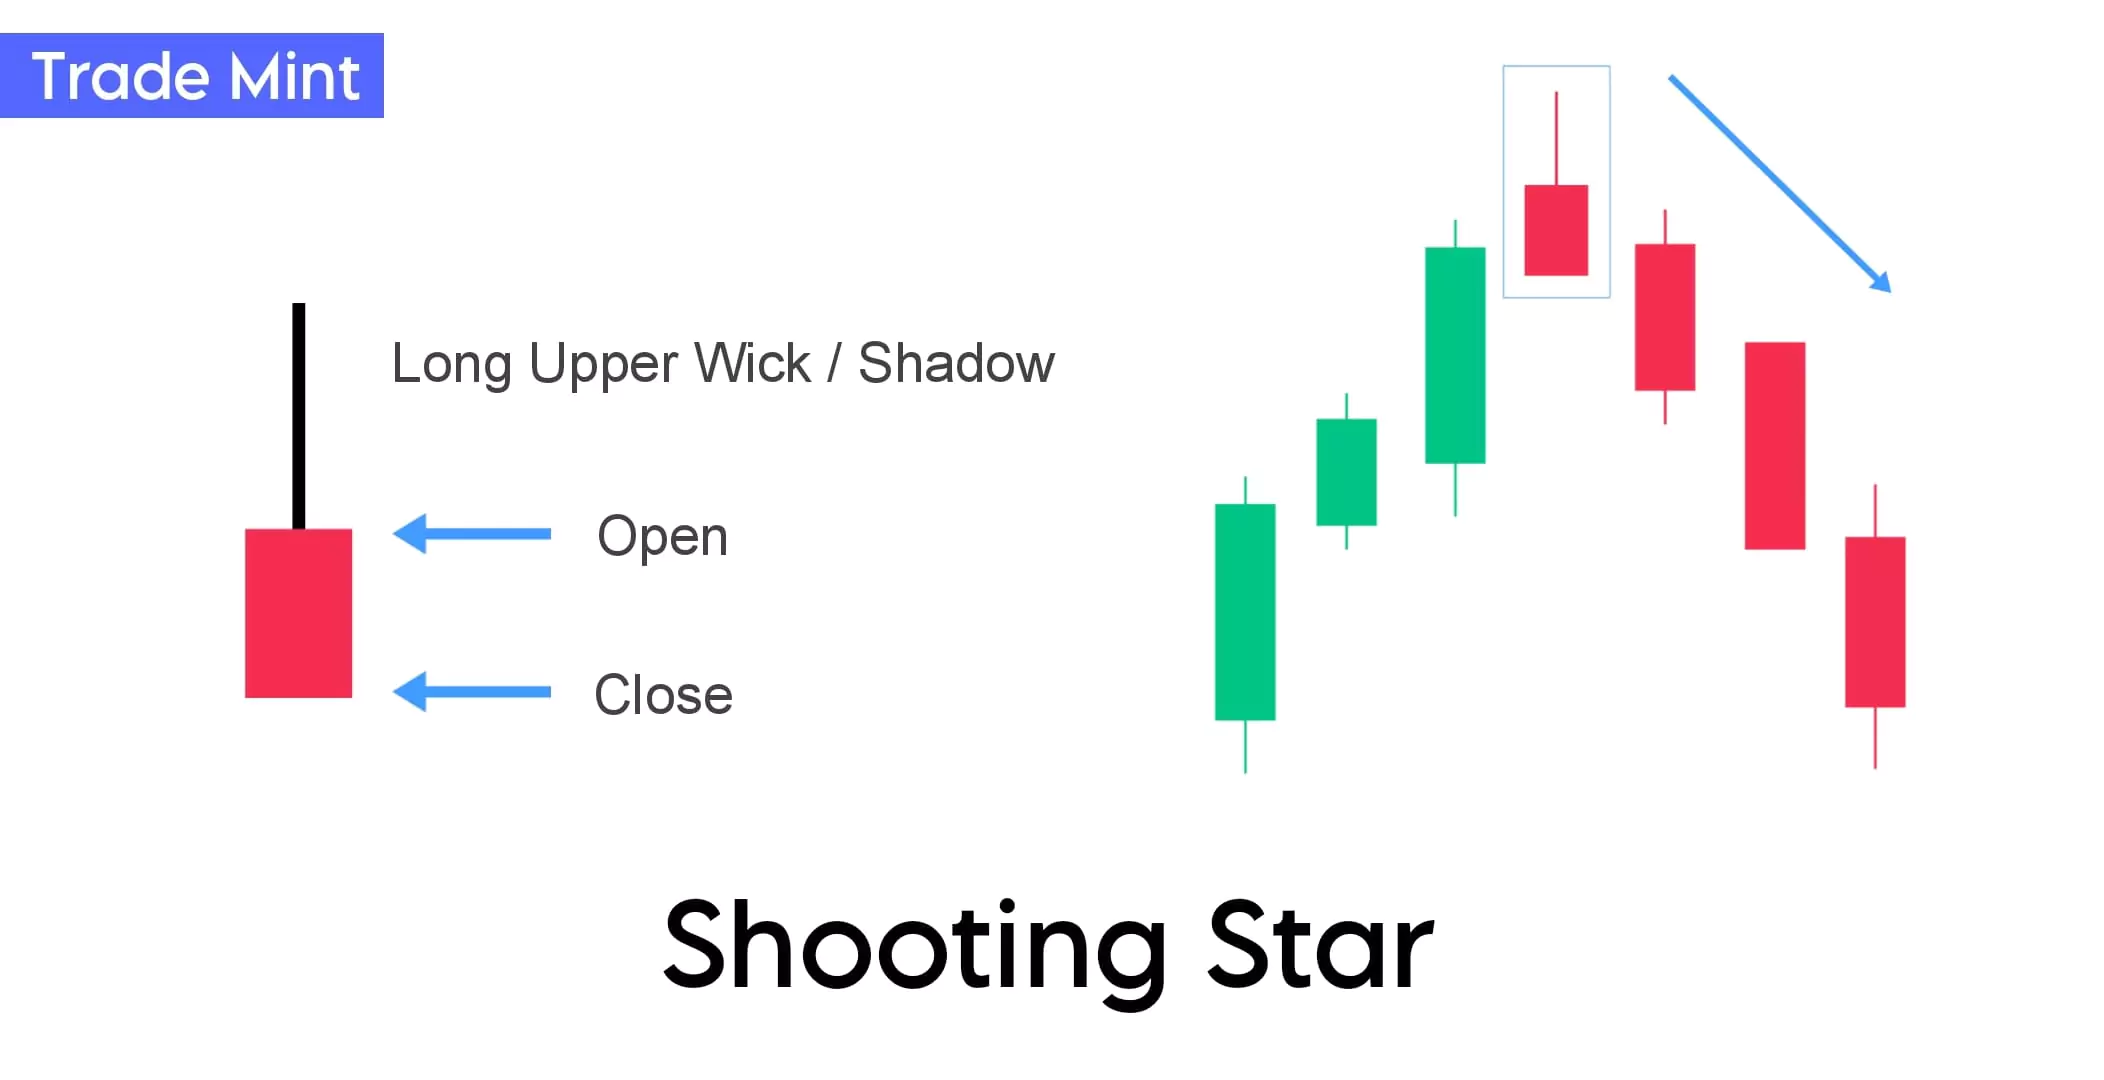
“The Shooting star candlestick pattern is a bearish reversal pattern, It forms as a single candlestick after an uptrend in the chart. A shooting star has an upper shadow twice as long as the real body. with almost no lower shadow.”
The psychology behind A Shooting Star is that, even though the price moved higher during the session, In the second session, sellers came in strongly and pushed the price back down. This rejection of higher prices suggests potential weakness in the uptrend and a possible sudden reversal. So the small body indicates that sellers maintained and prevented further buying pressure.
Guide: Traders should enter in a short position only after the confirmation of the second candle closing below the shooting star candle. Now a stop-loss can be placed at the high of the shooting star’s shadow.
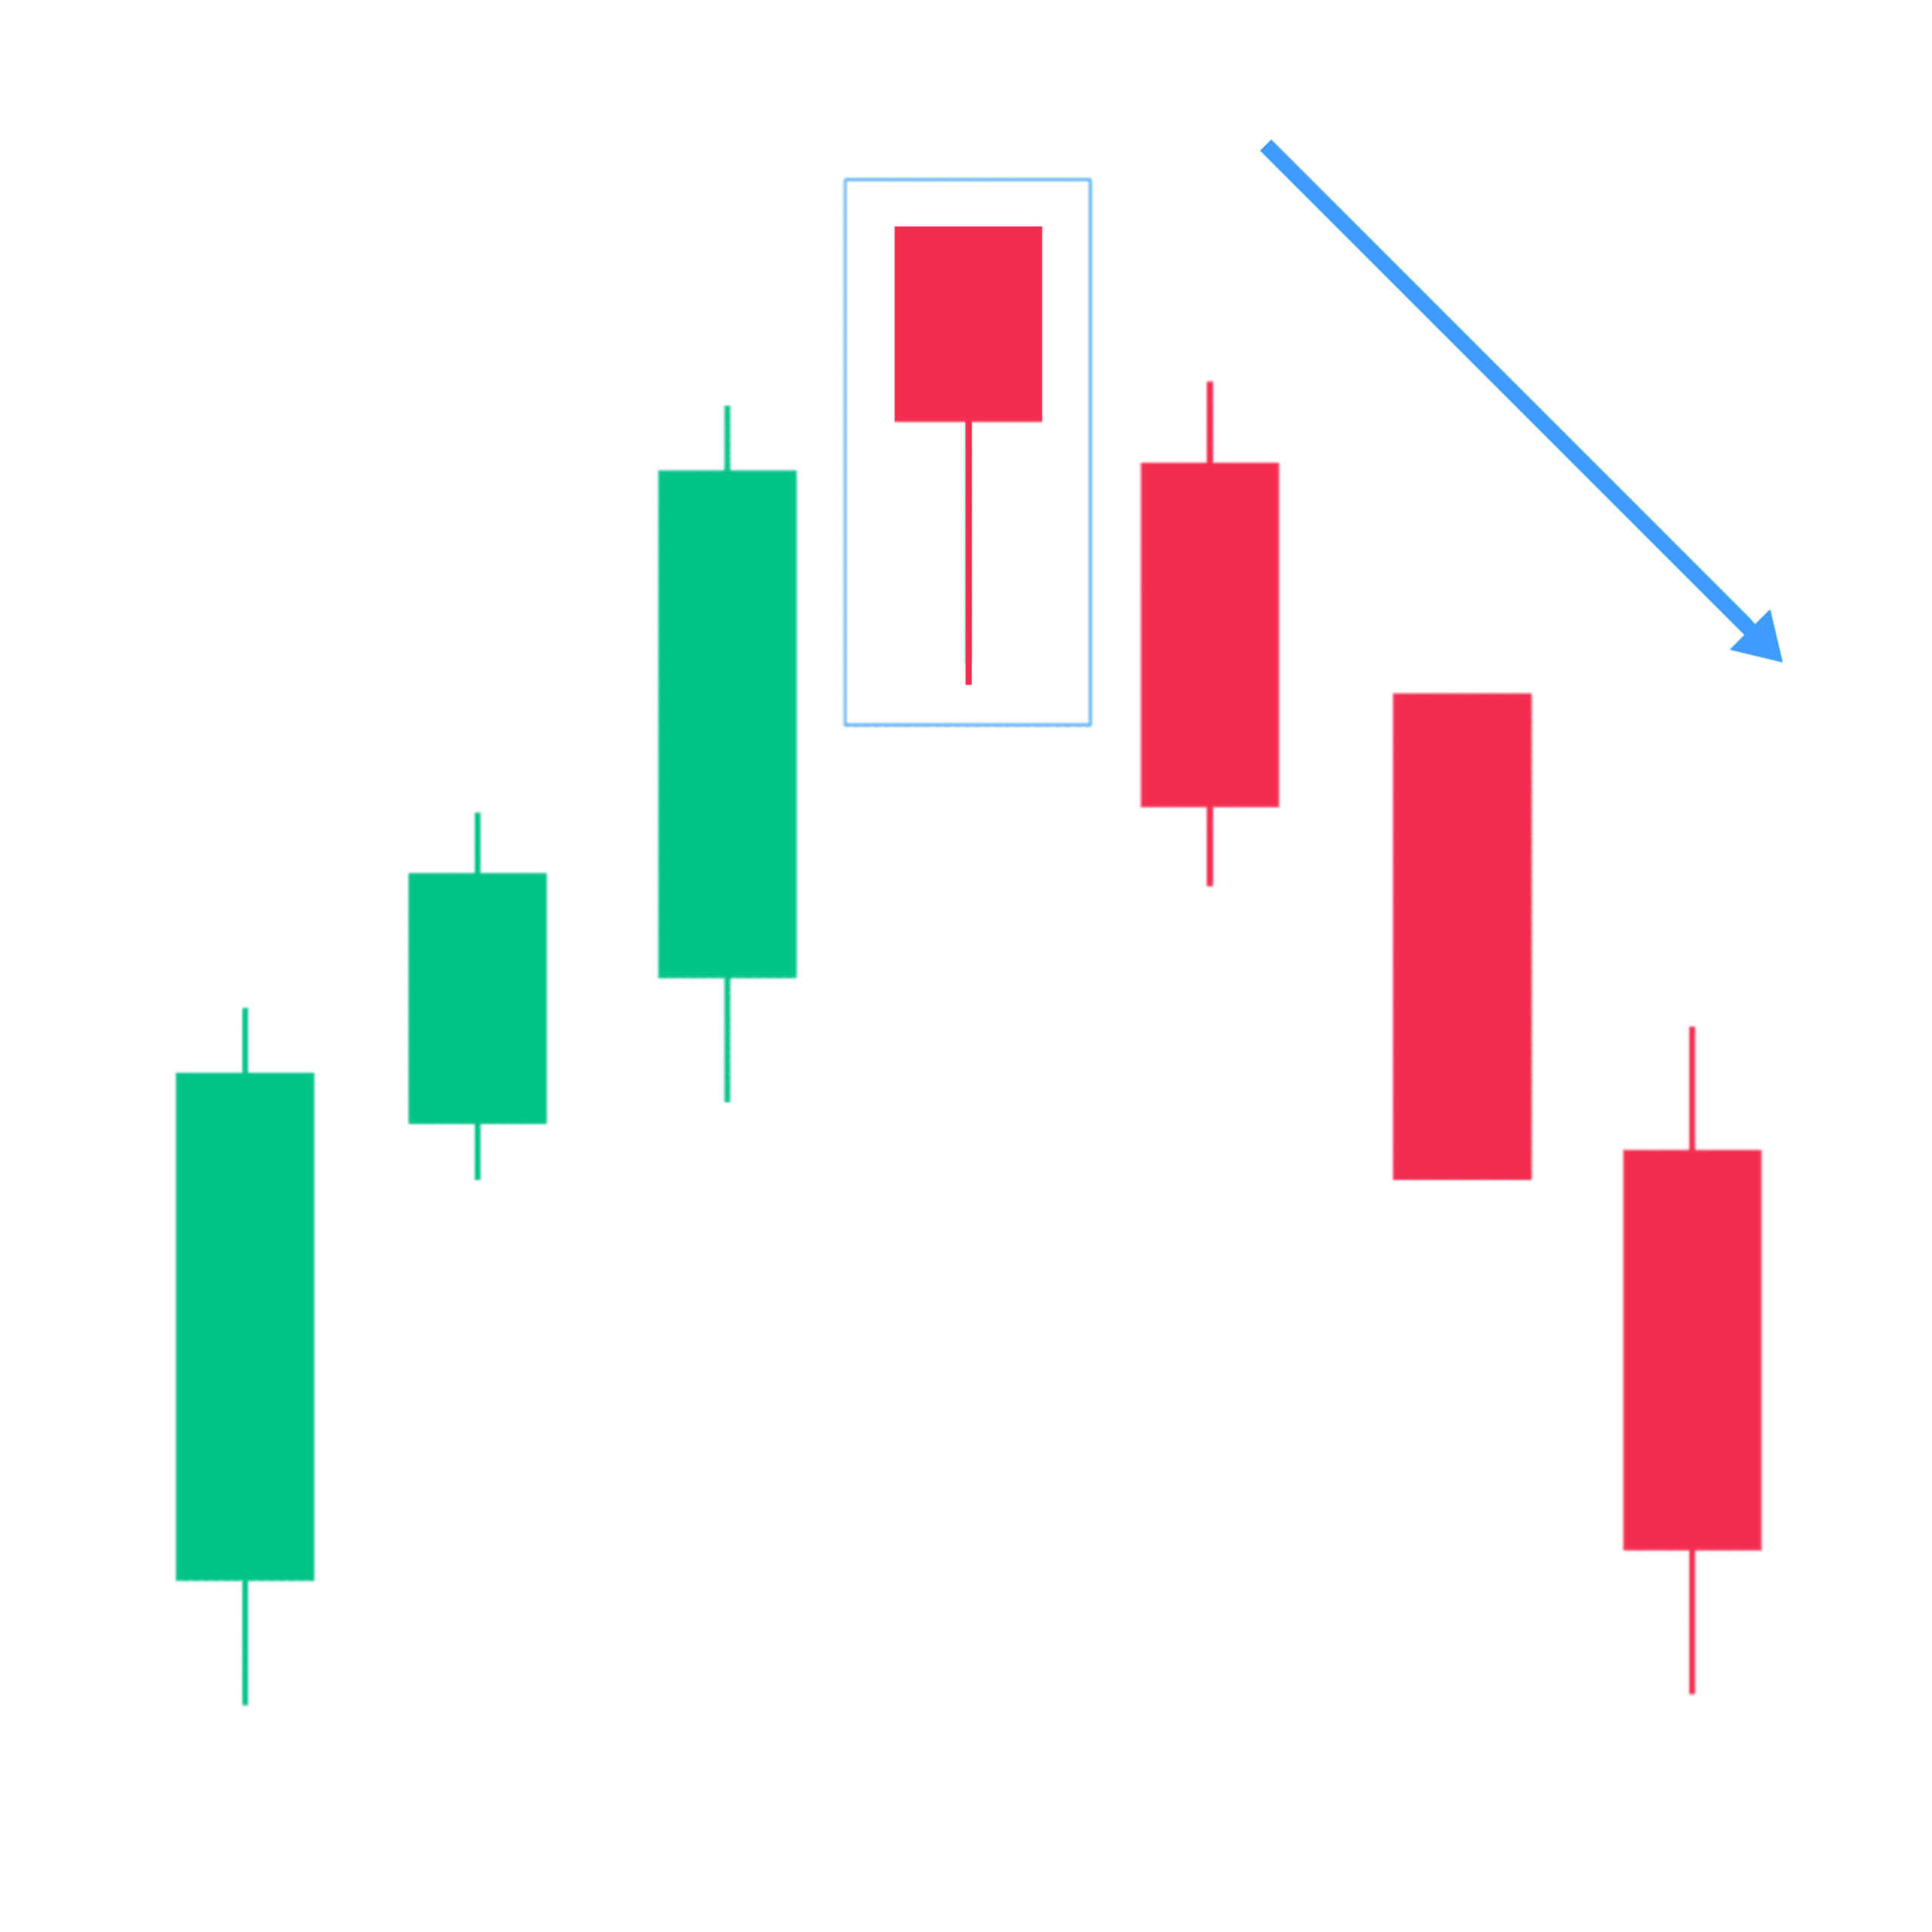
2. Hanging Man
The hanging man is a single candle, bearish reversal candlestick pattern that forms at the end of an uptrend and signals a potential trend reversal.
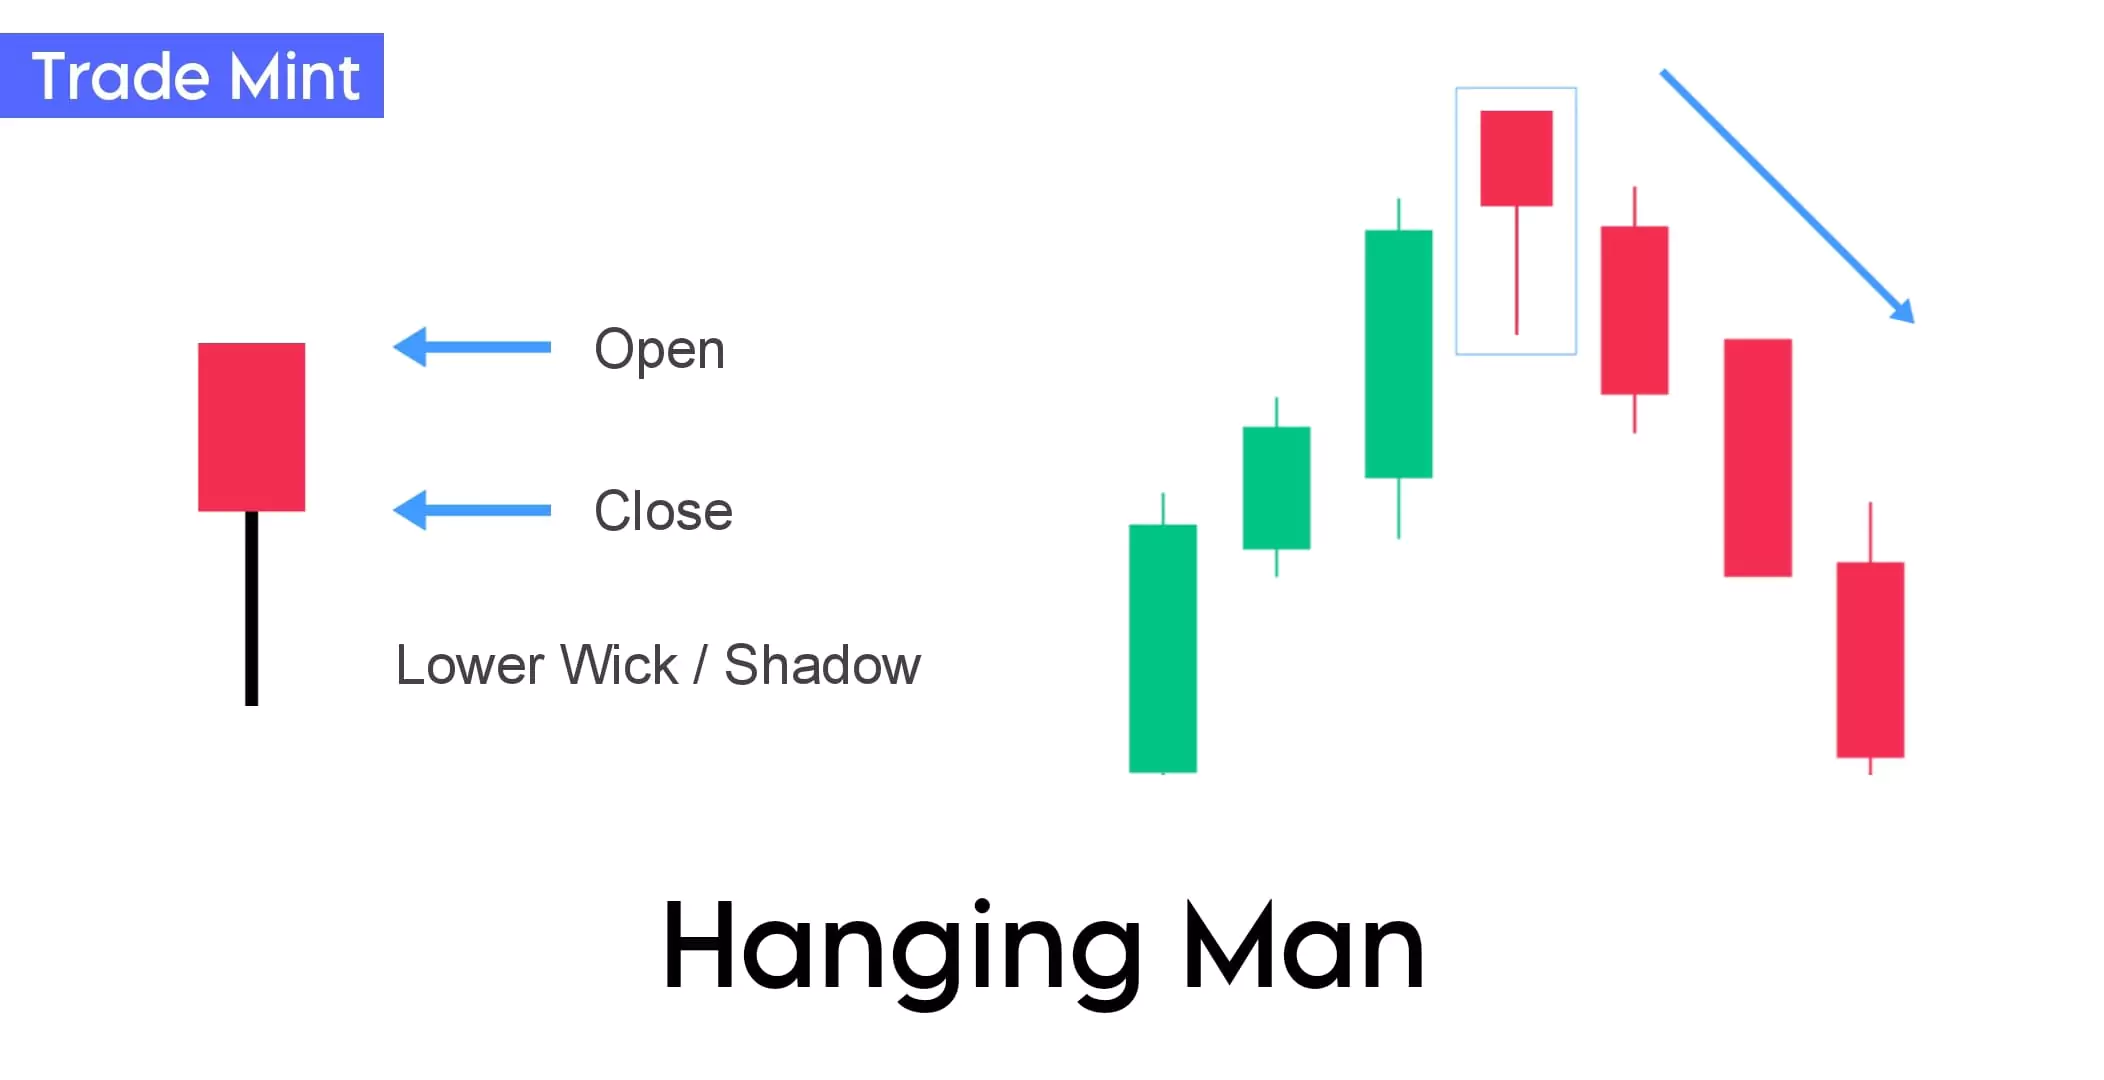
The hanging man candlestick has a small body shown at the top of the candle and a long lower shadow. The long lower shadow must be at least twice as long as the given candle’s body, and there must be a small or no upper shadow.
Hanging man is a single candle pattern, This pattern shows buyers pushed prices back to where they were at the open, but decreasing prices show that sellers are testing the power of the buyers in this trading session.
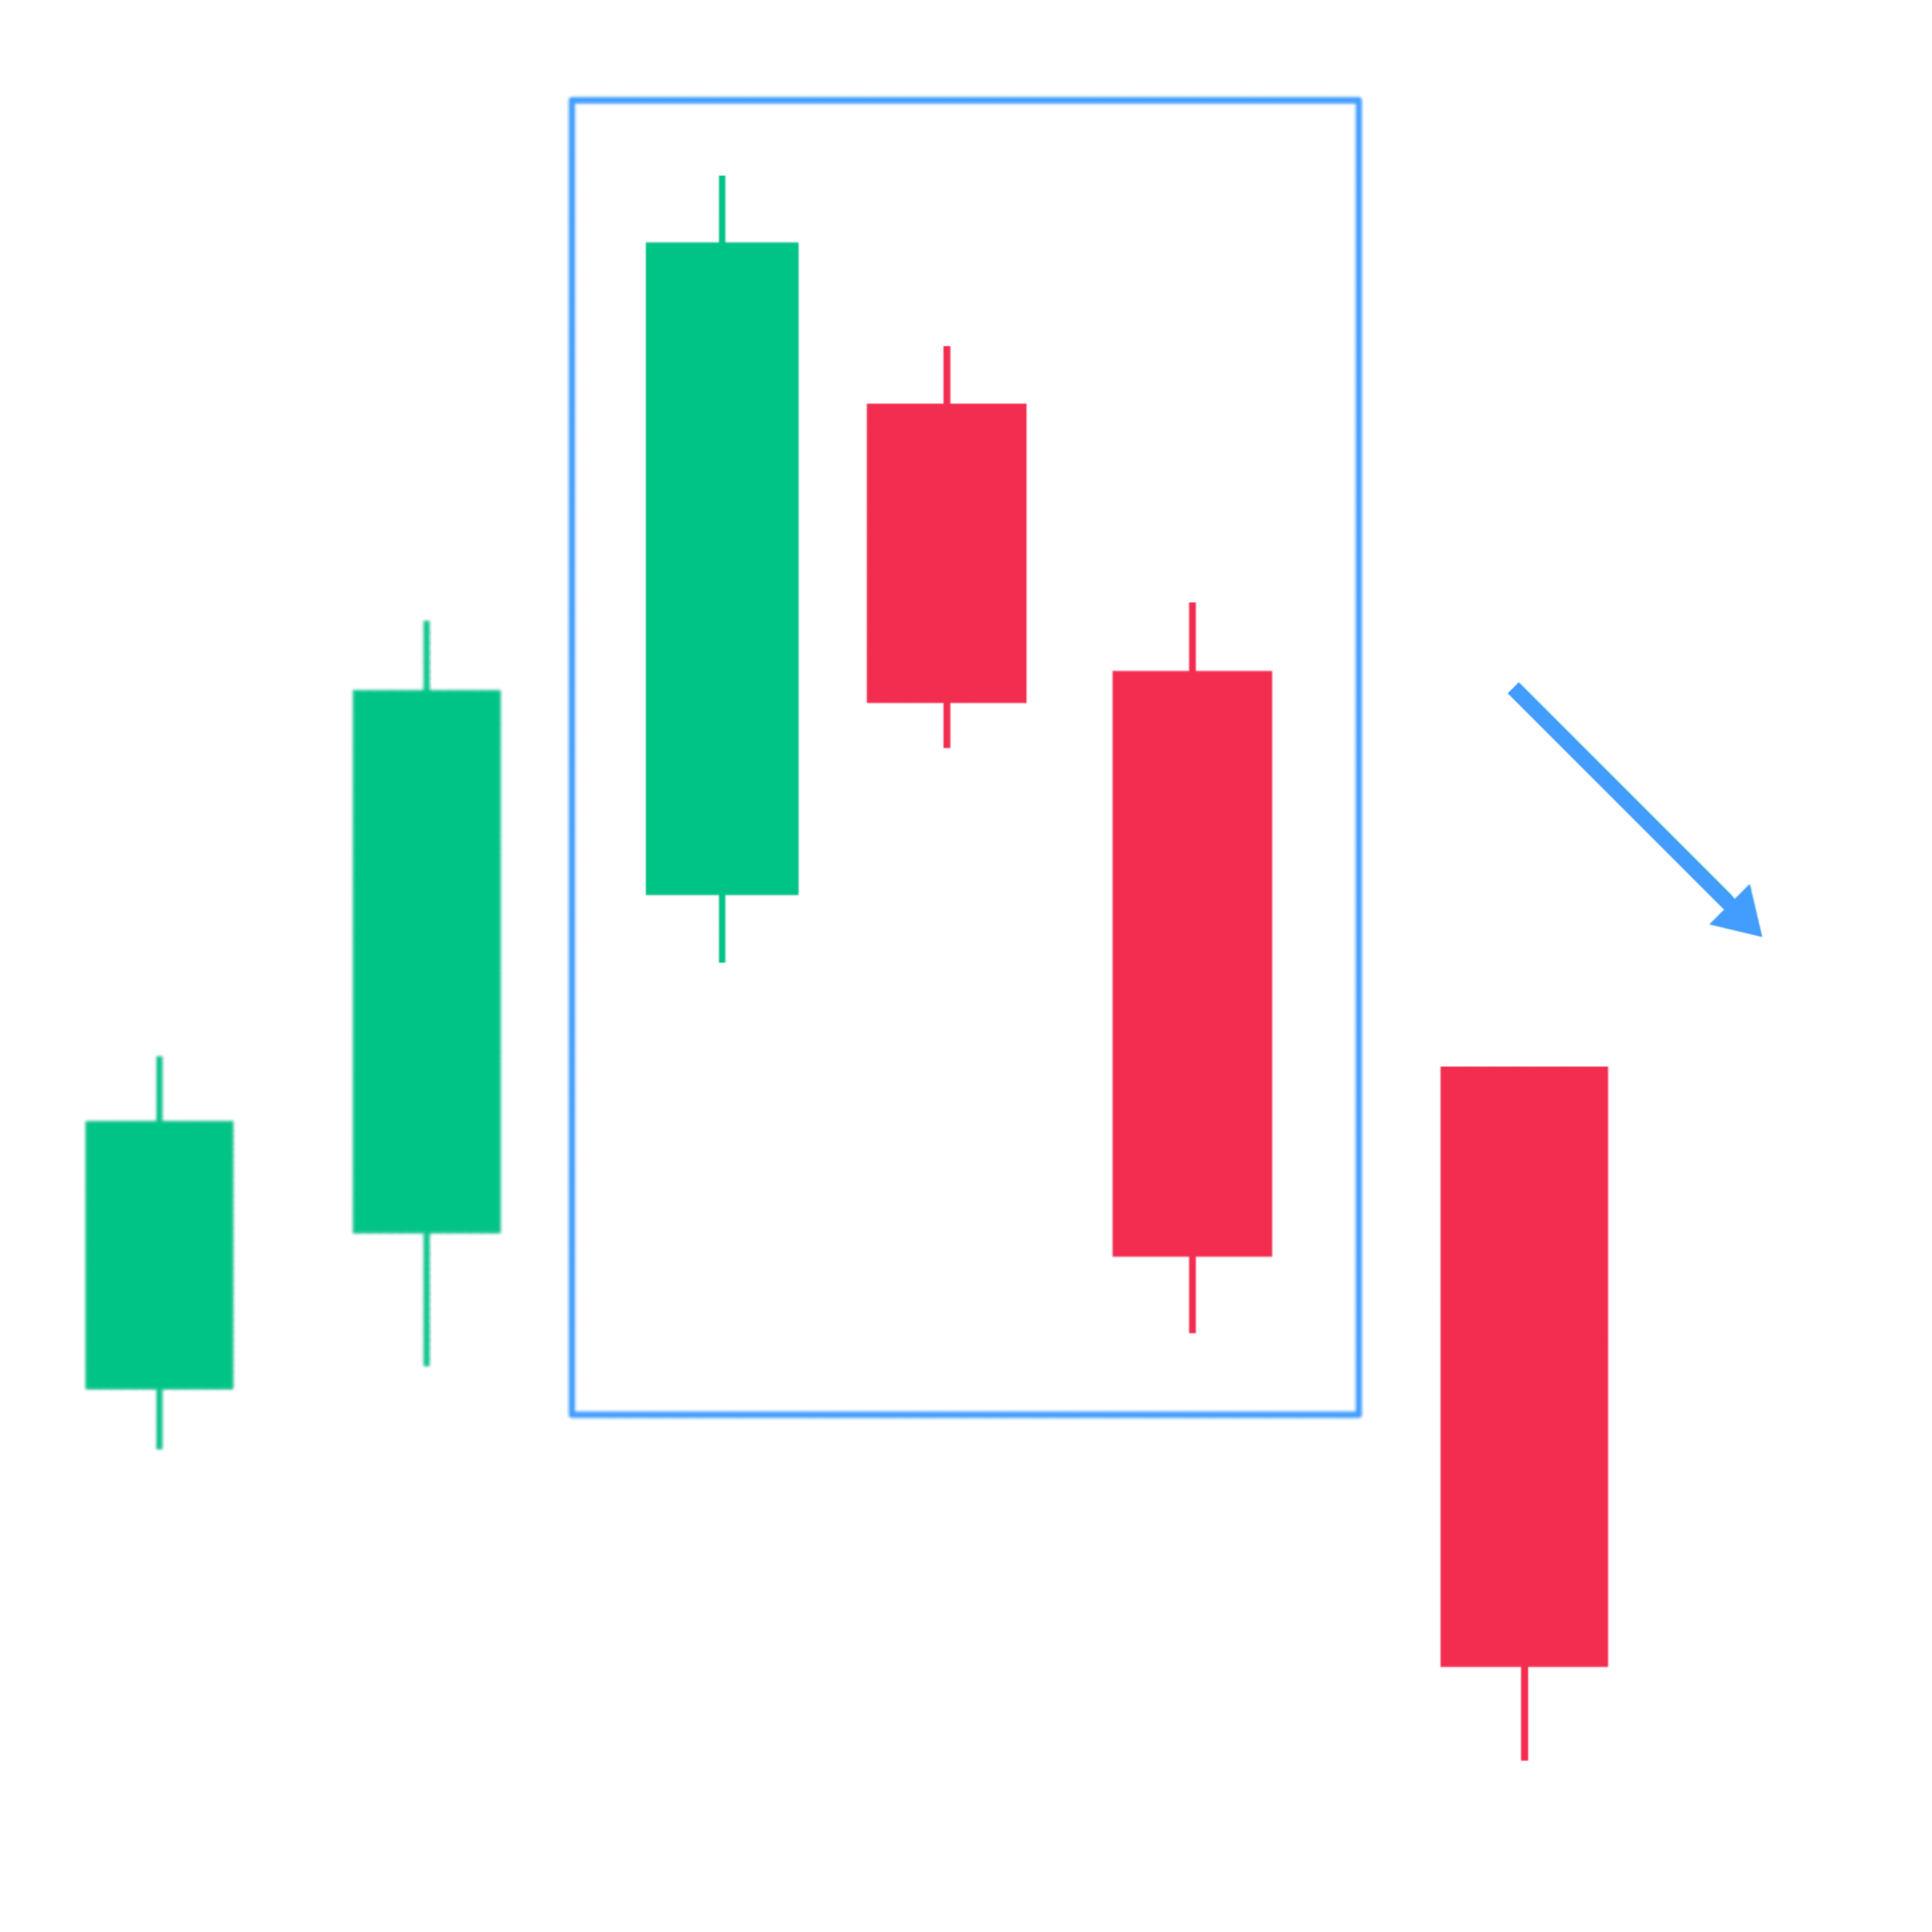
3. Bearish Engulfing
The Bearish engulfing candlestick pattern is one of the most common patterns used by traders to identify trend reversals and continuations after a pullback/retracement in the markets.
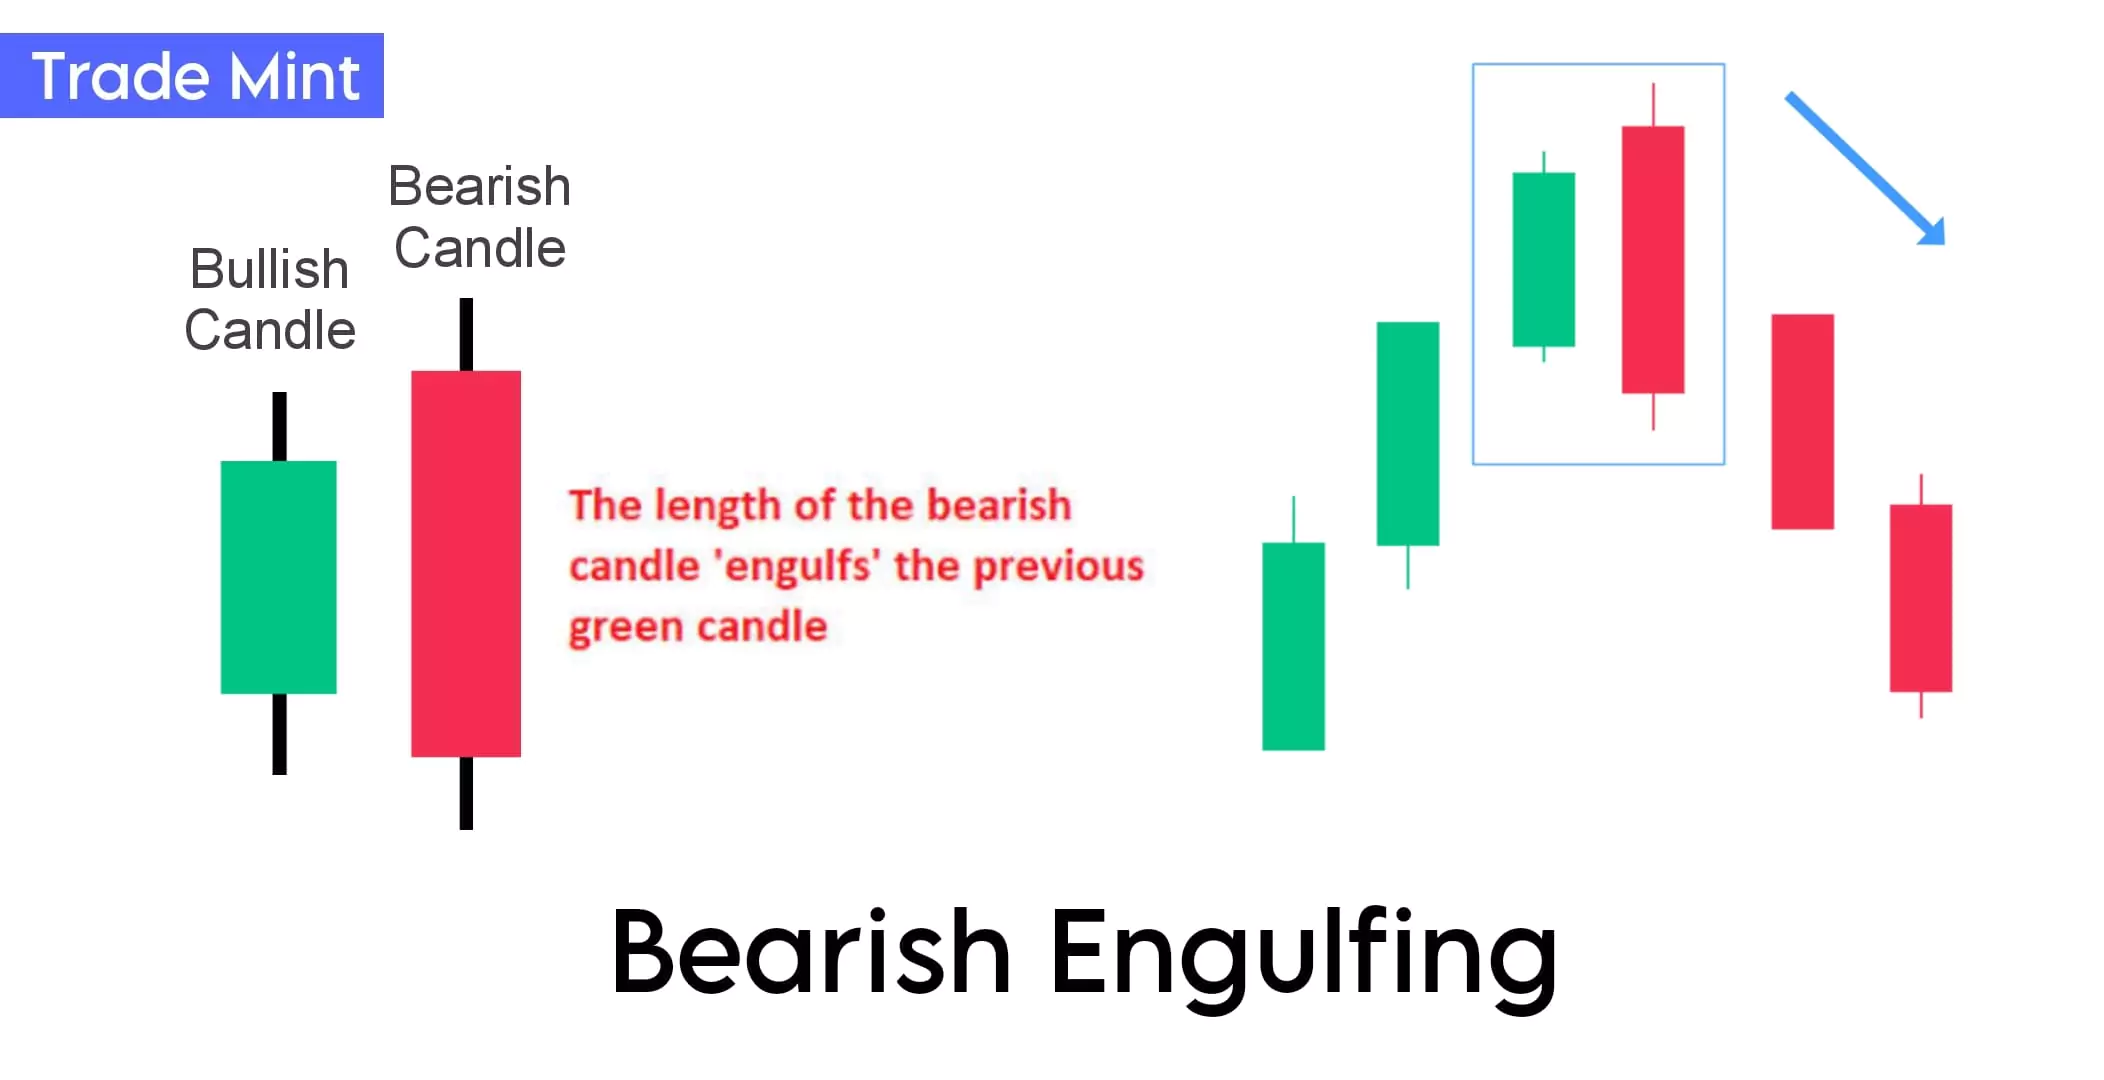
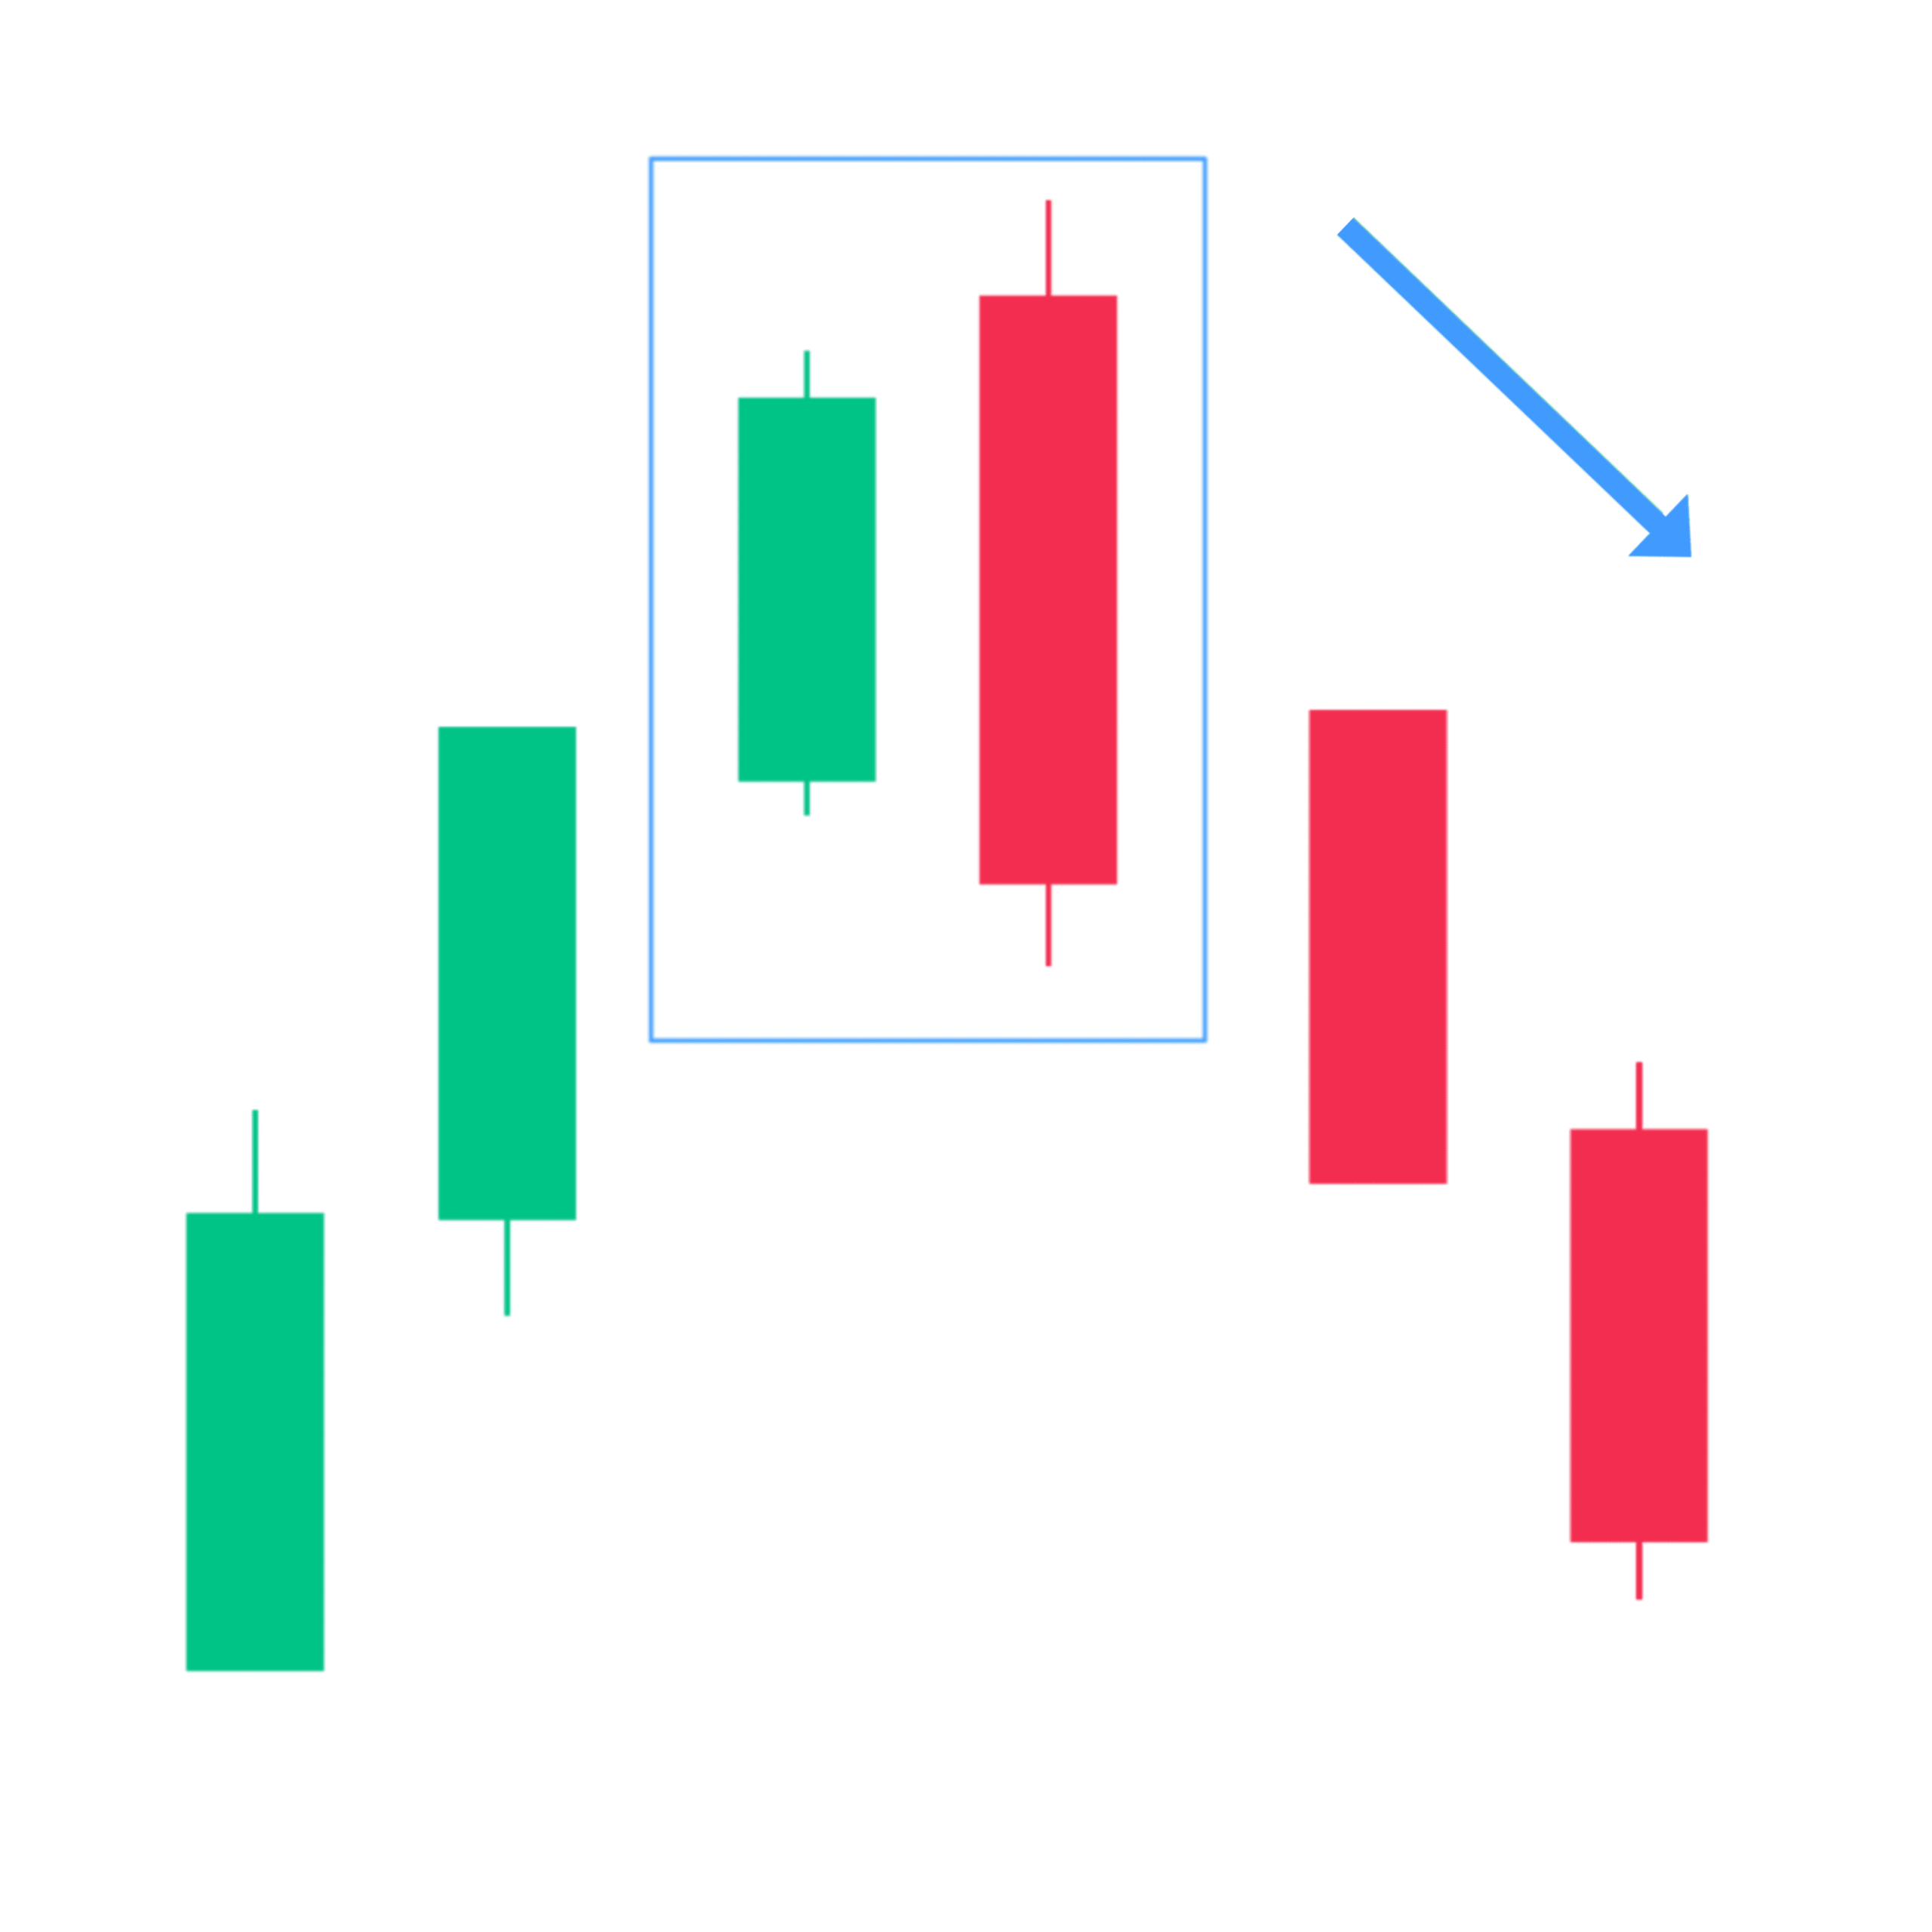
“The bearish engulfing candlestick pattern consists of two candles, where the second bearish/red candle’s body completely ‘engulfs’ the first bullish/green candle’s body. It is formed at the top of the chart.”
The bearish engulfing pattern suggests a sudden and strong shift from bullish to bearish sentiment.
The larger size of the second bearish candle indicates the strong dominance of sellers over the earlier bullish momentum.
Traders can enter/create a short position if next. a bearish candle is formed and can place a stop-loss at the high of the second candle.
4. Bearish Harami
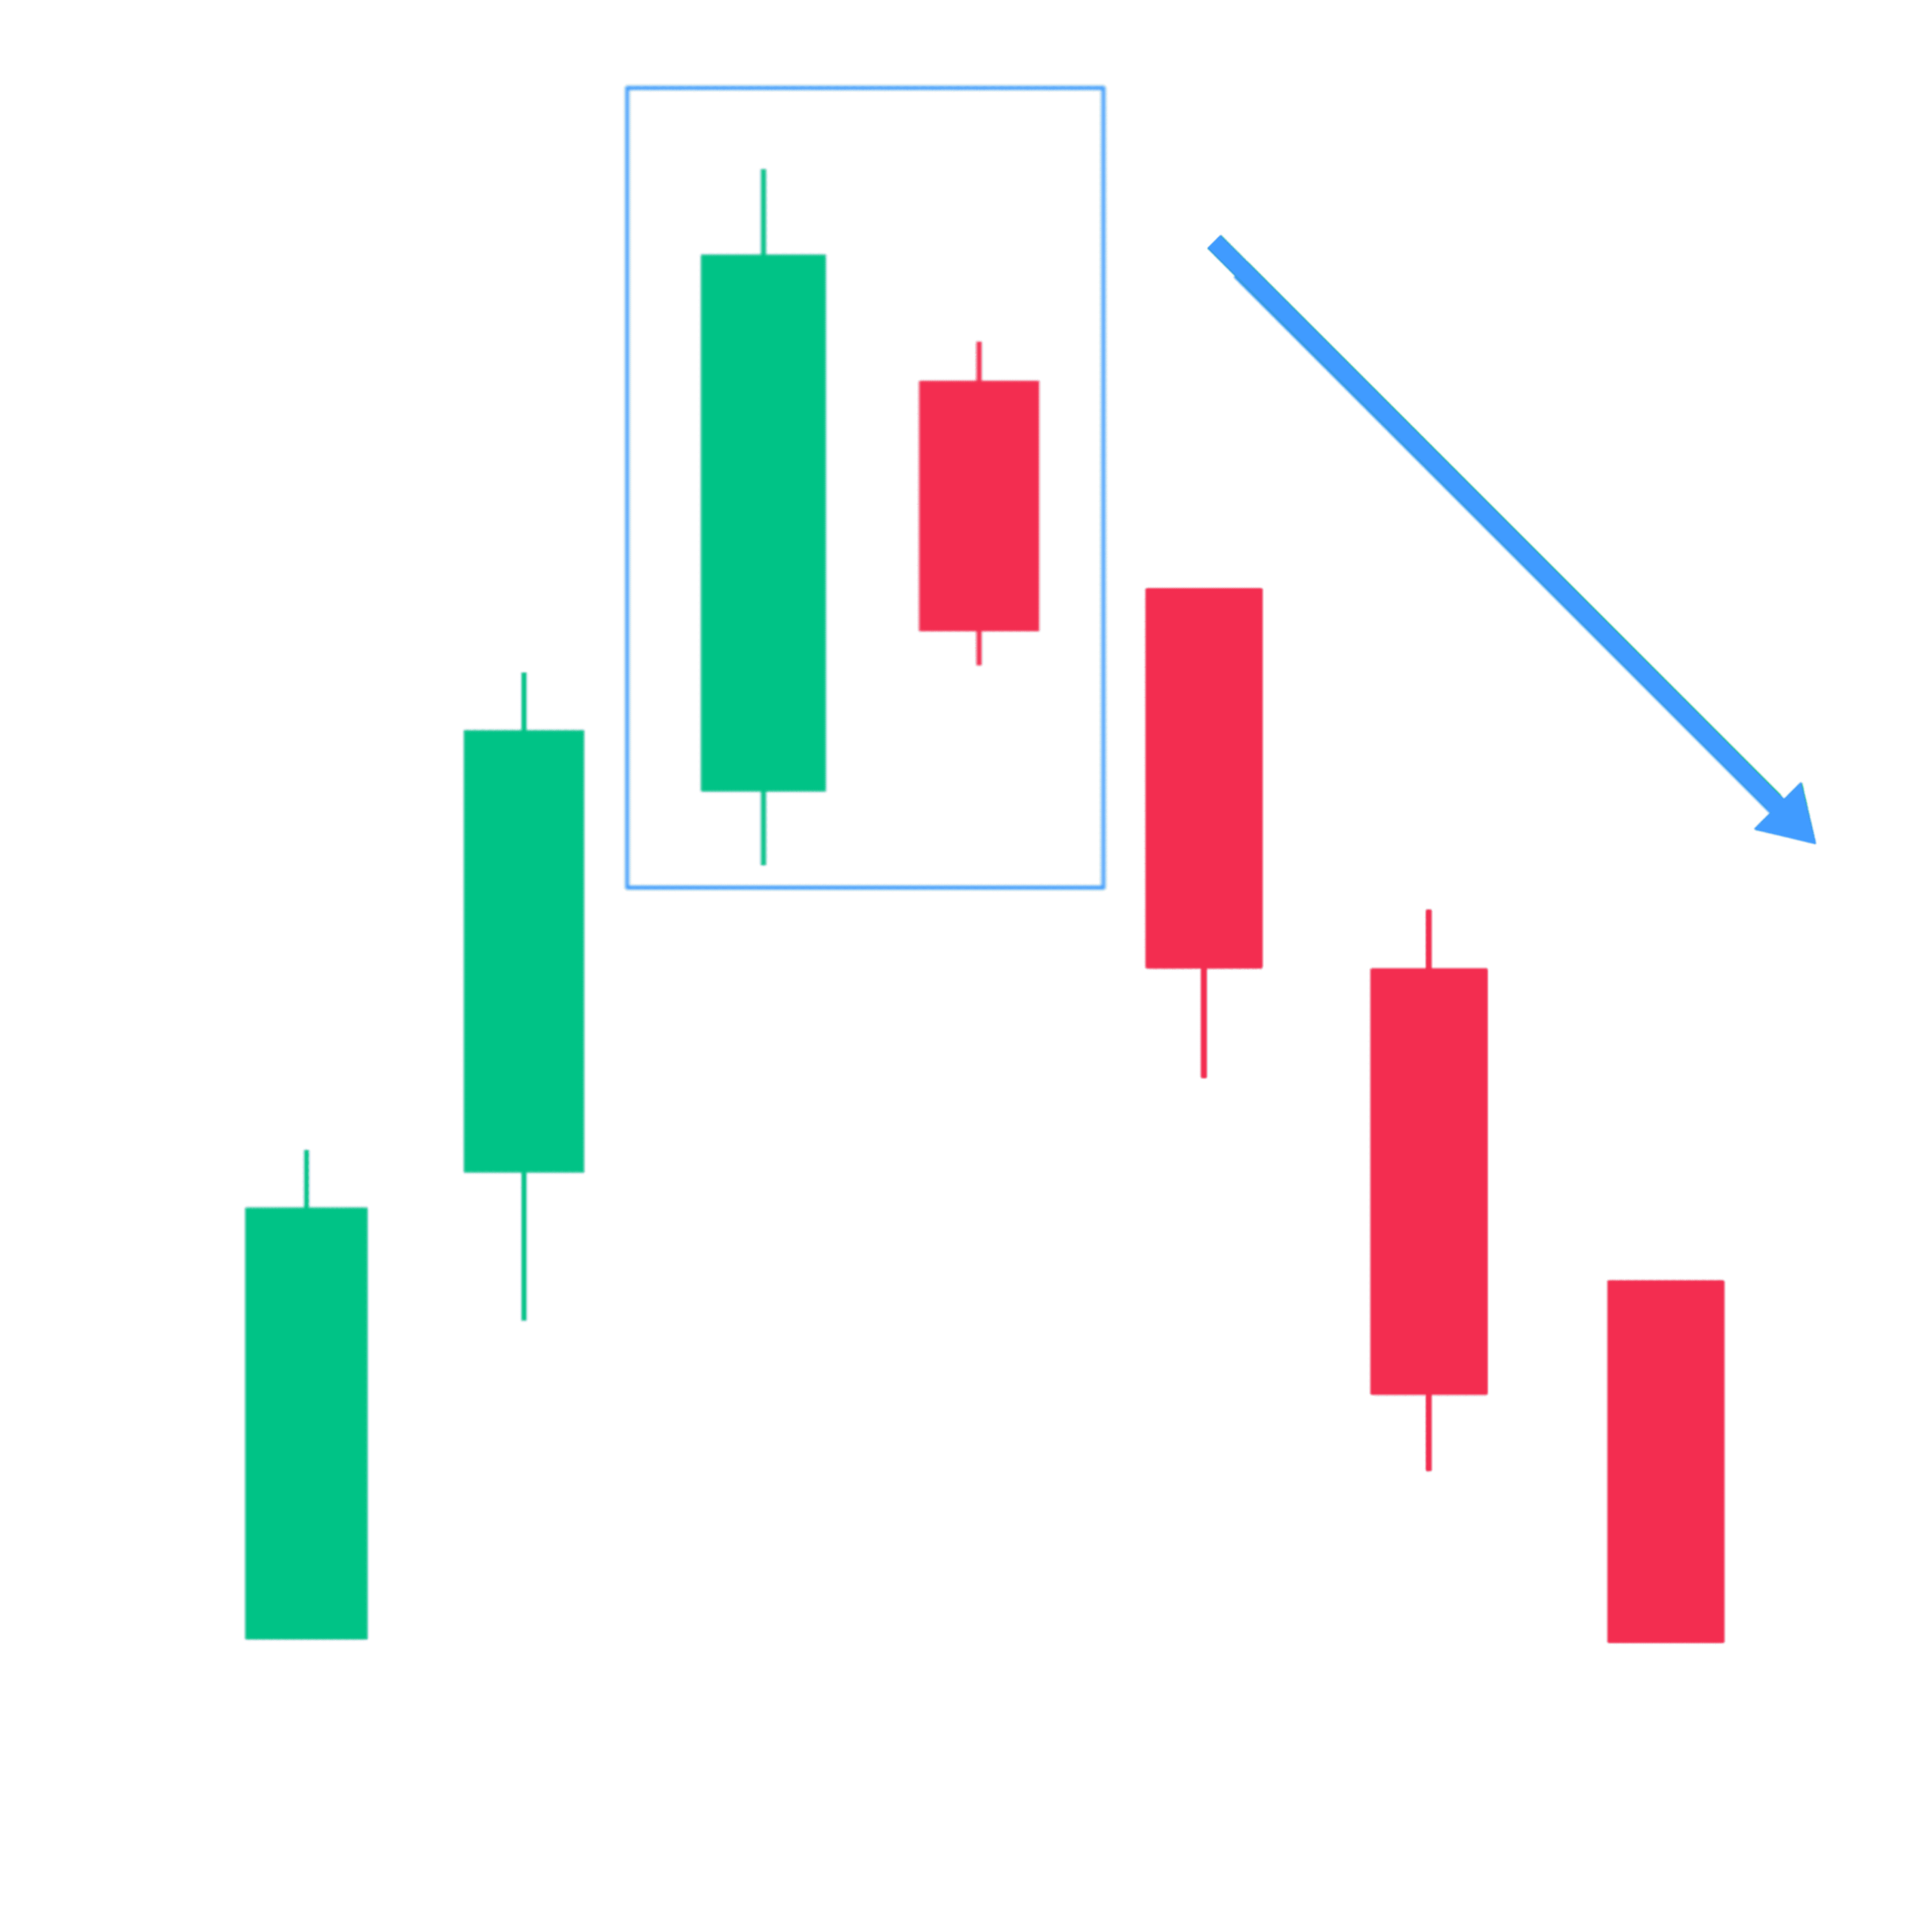
The bearish harami pattern or bearish inside pattern indicates a possible trend reversal.
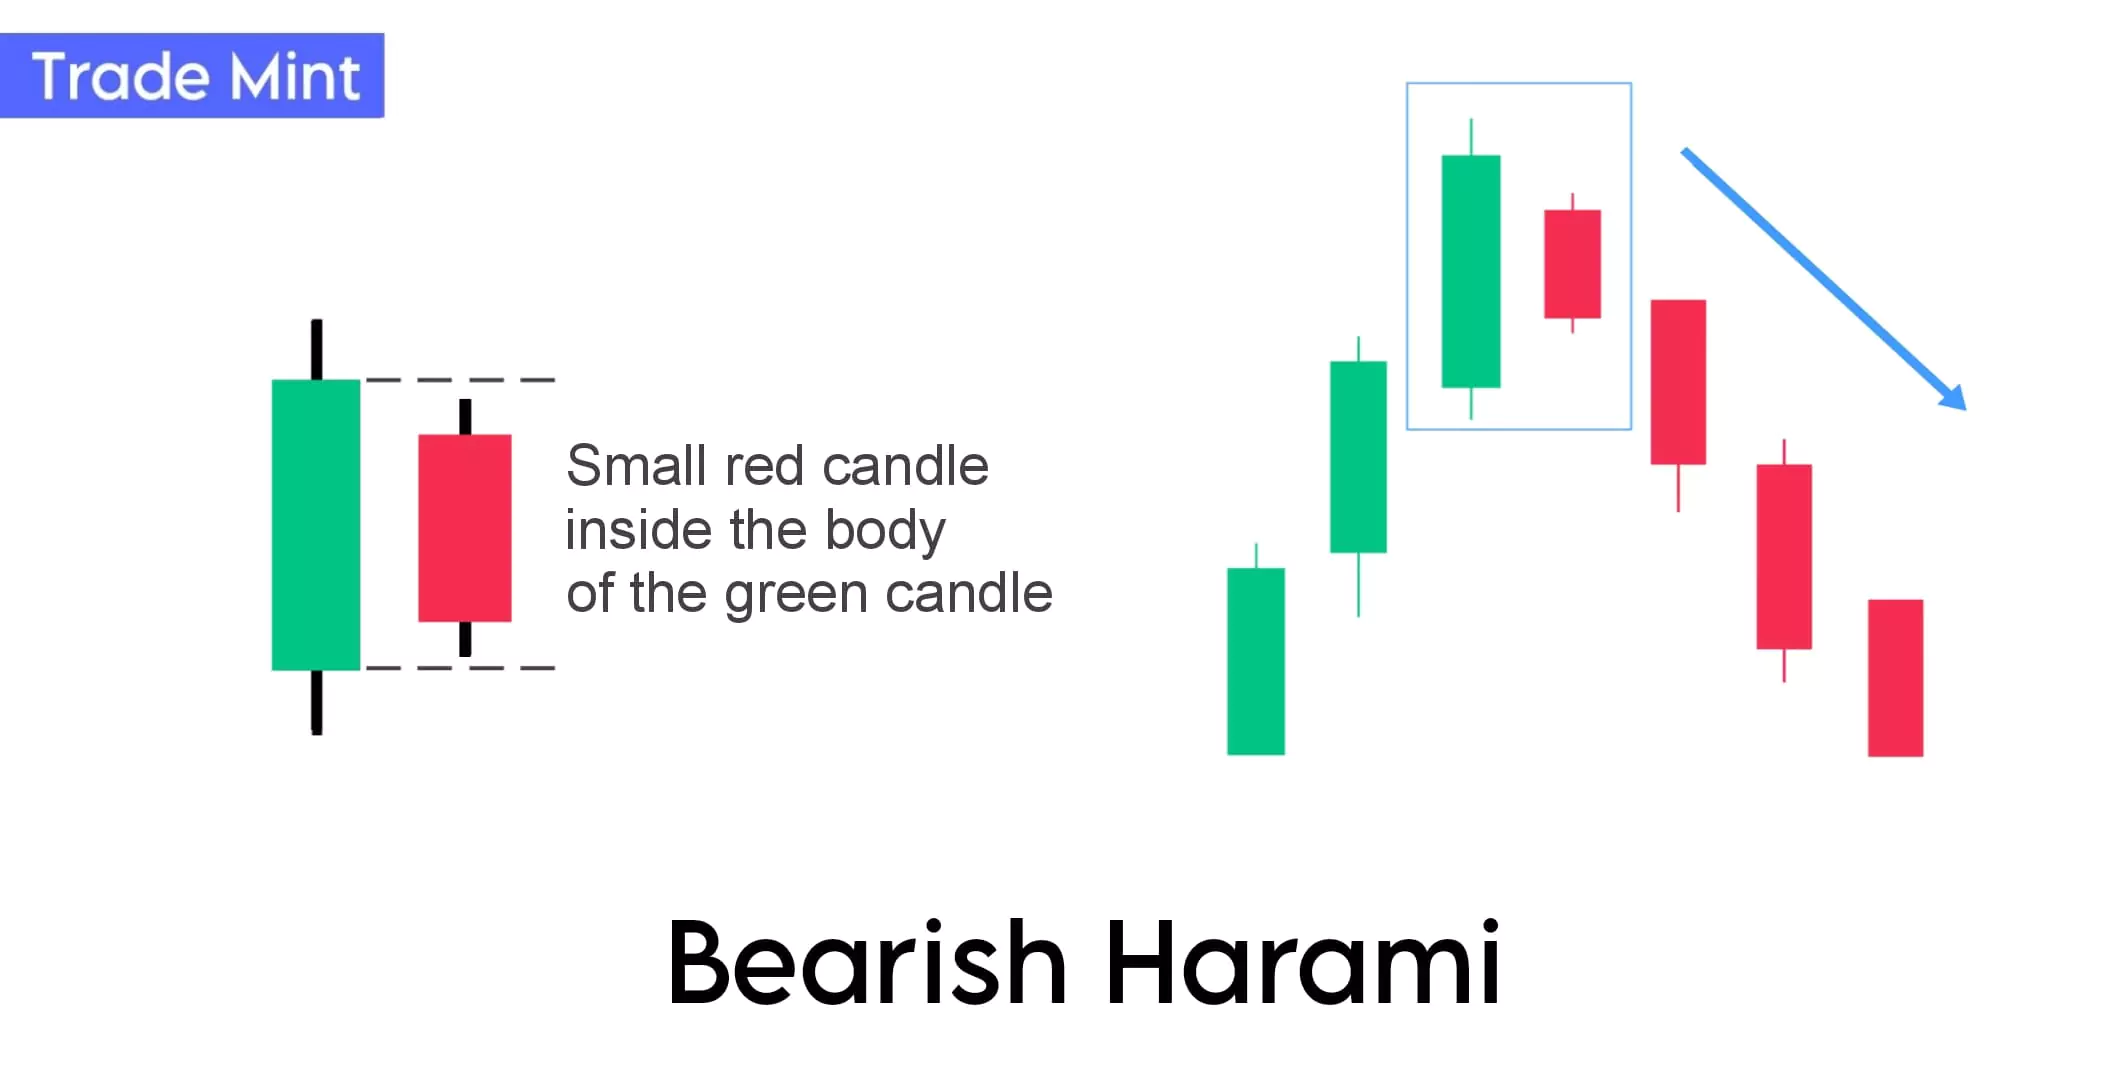
The bearish harami is a two-candle pattern that signals a potential reversal in an uptrend. The first candle is usually a strong buying candle, and the second candle’s open and close are within the range of the first candle’s body or the second candle has a small body red candle that is completely inside the range of the previous candle. A Harami candlestick is also known as inside candle or a baby candle.
The smaller size of the second bearish candle indicates indecision or a struggle between buyers and sellers.
After the completion of this candlestick pattern, traders can take a short position.
5. Bearish Marubozu
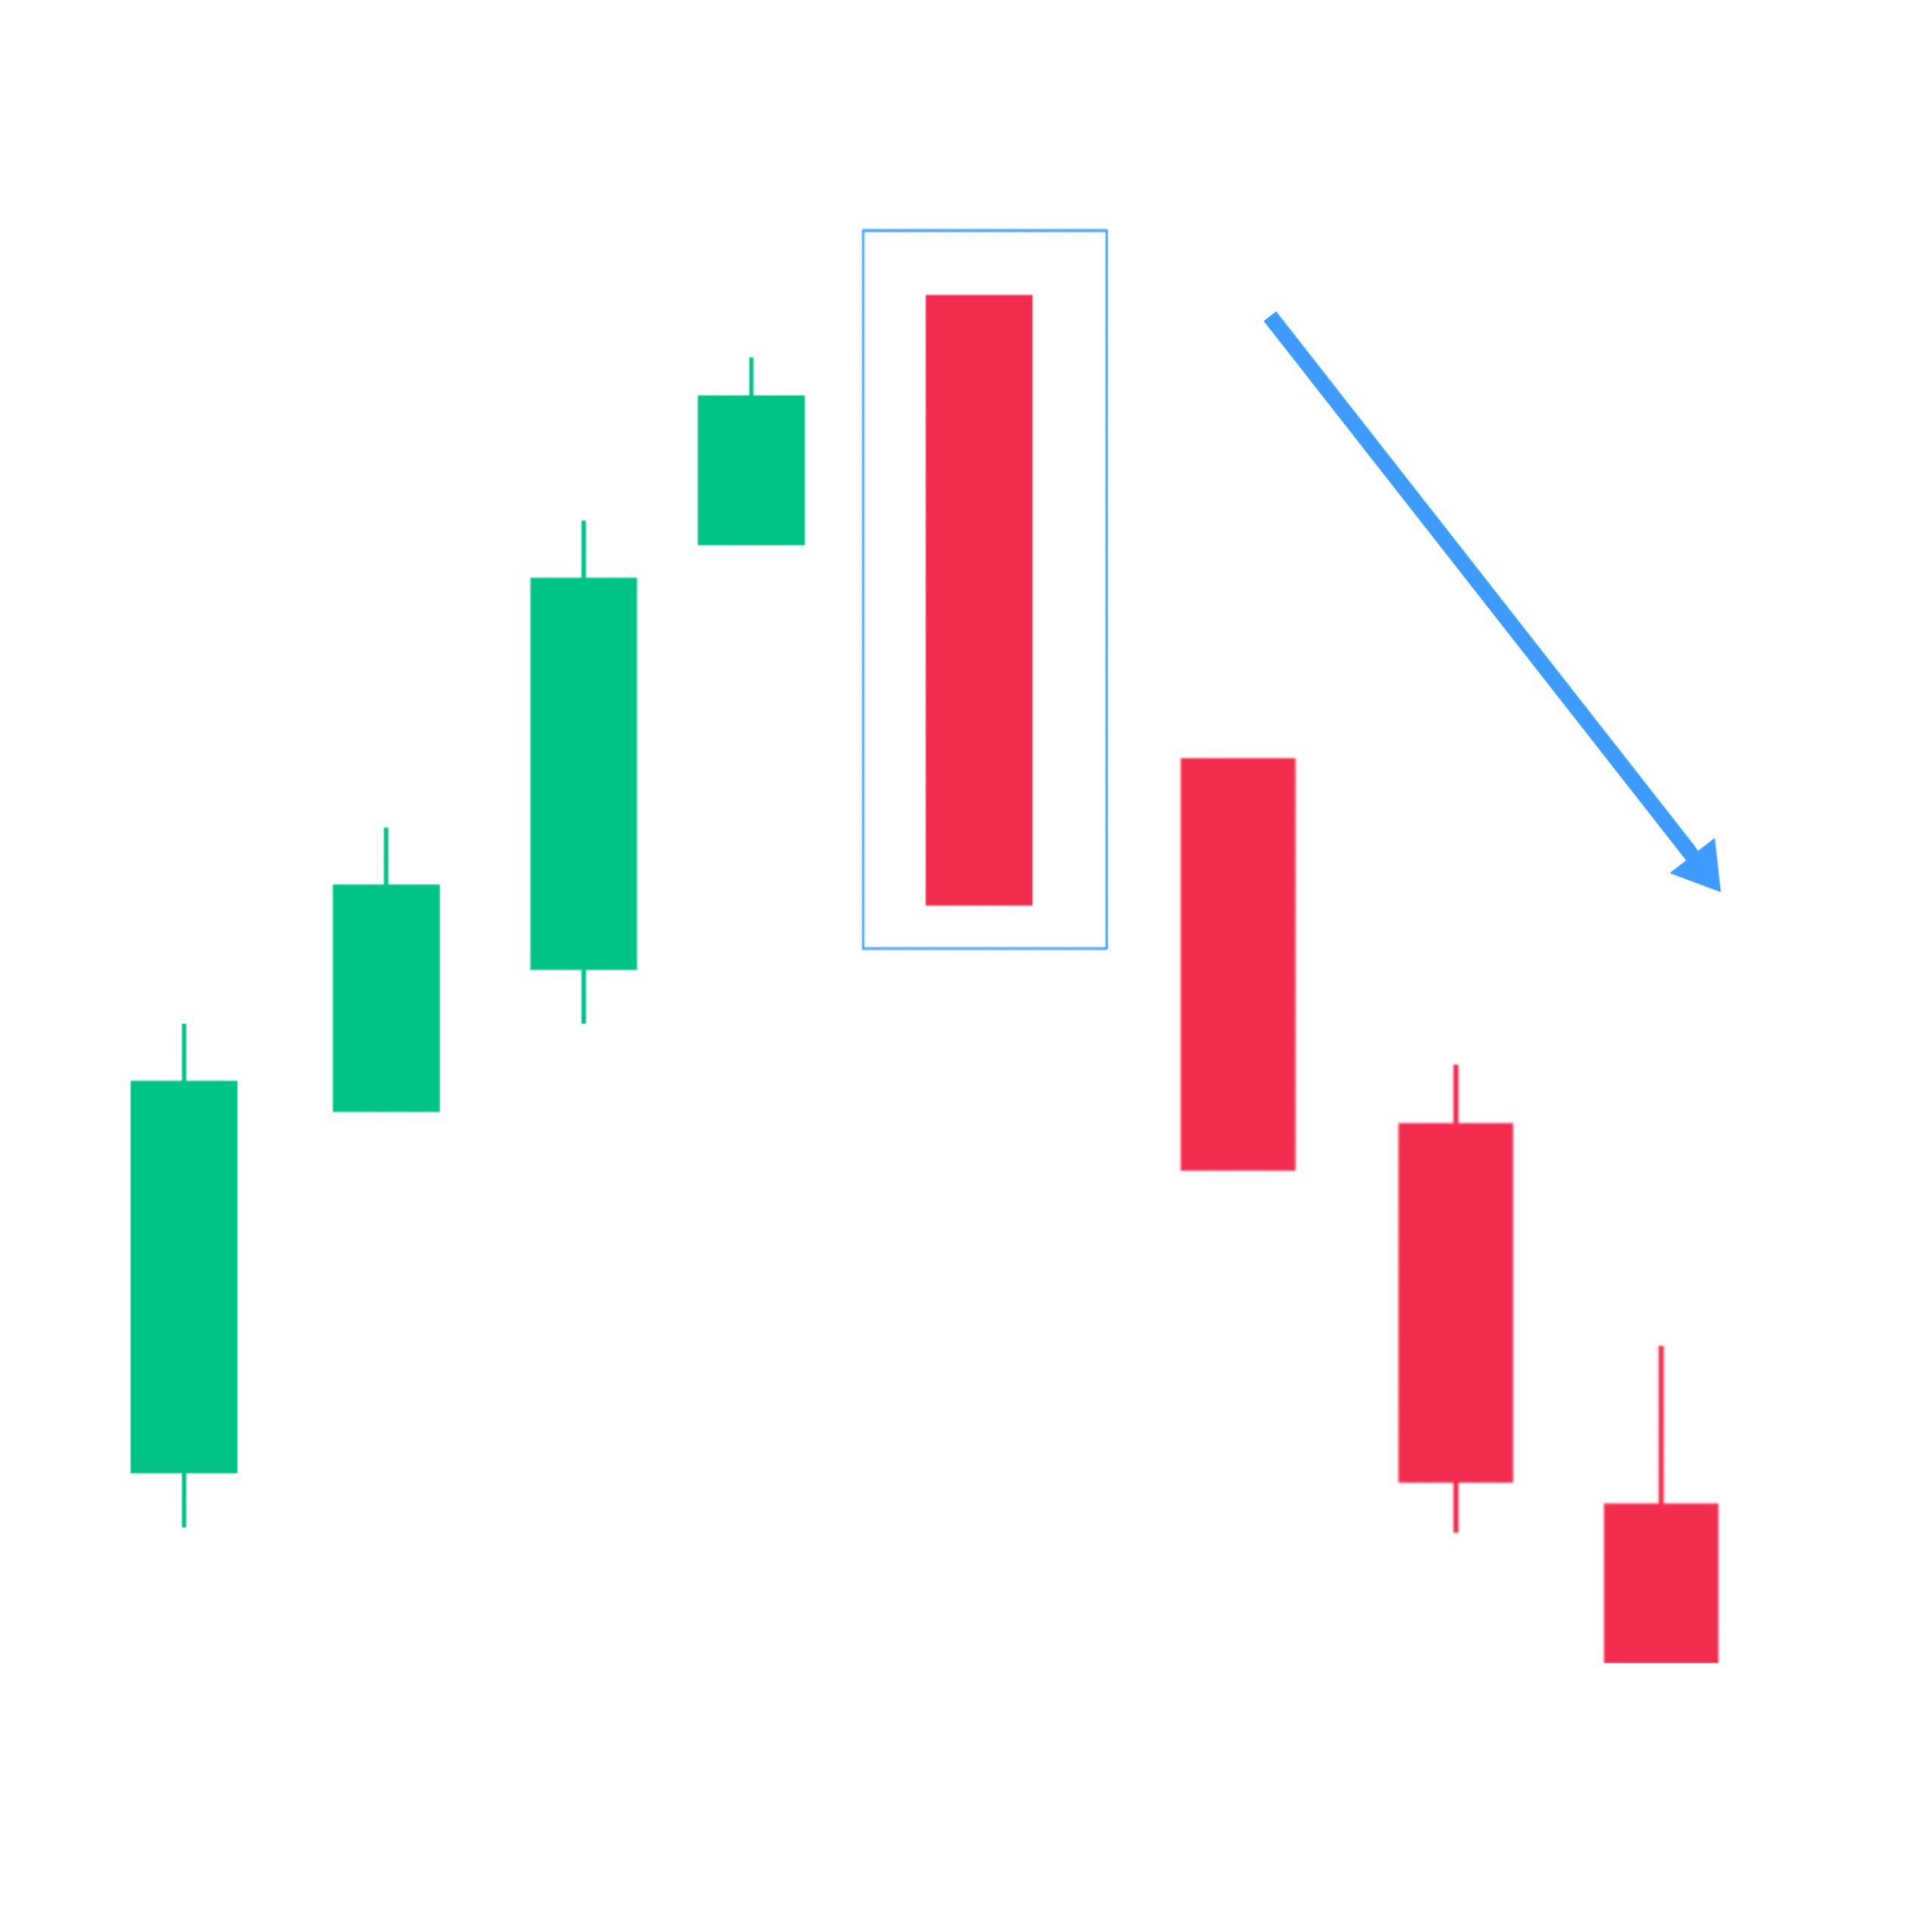
The Bearish/black Marubozu is a single candlestick pattern that formed in an uptrend and indicates a potential bearish reverse signal.

Bearish Marubozu is a long red candlestick with no upper or lower wick. This candle indicates that sellers controlled the market price from the top to the bottom, suggesting a strong bearish reversal or bearish sentiments in the market.
A Bearish/Black Marubozu forms when “Open equals high, and close equals low”. This indicates that sellers completely controlled the price action from the first to the last trade and created a strong red candle.
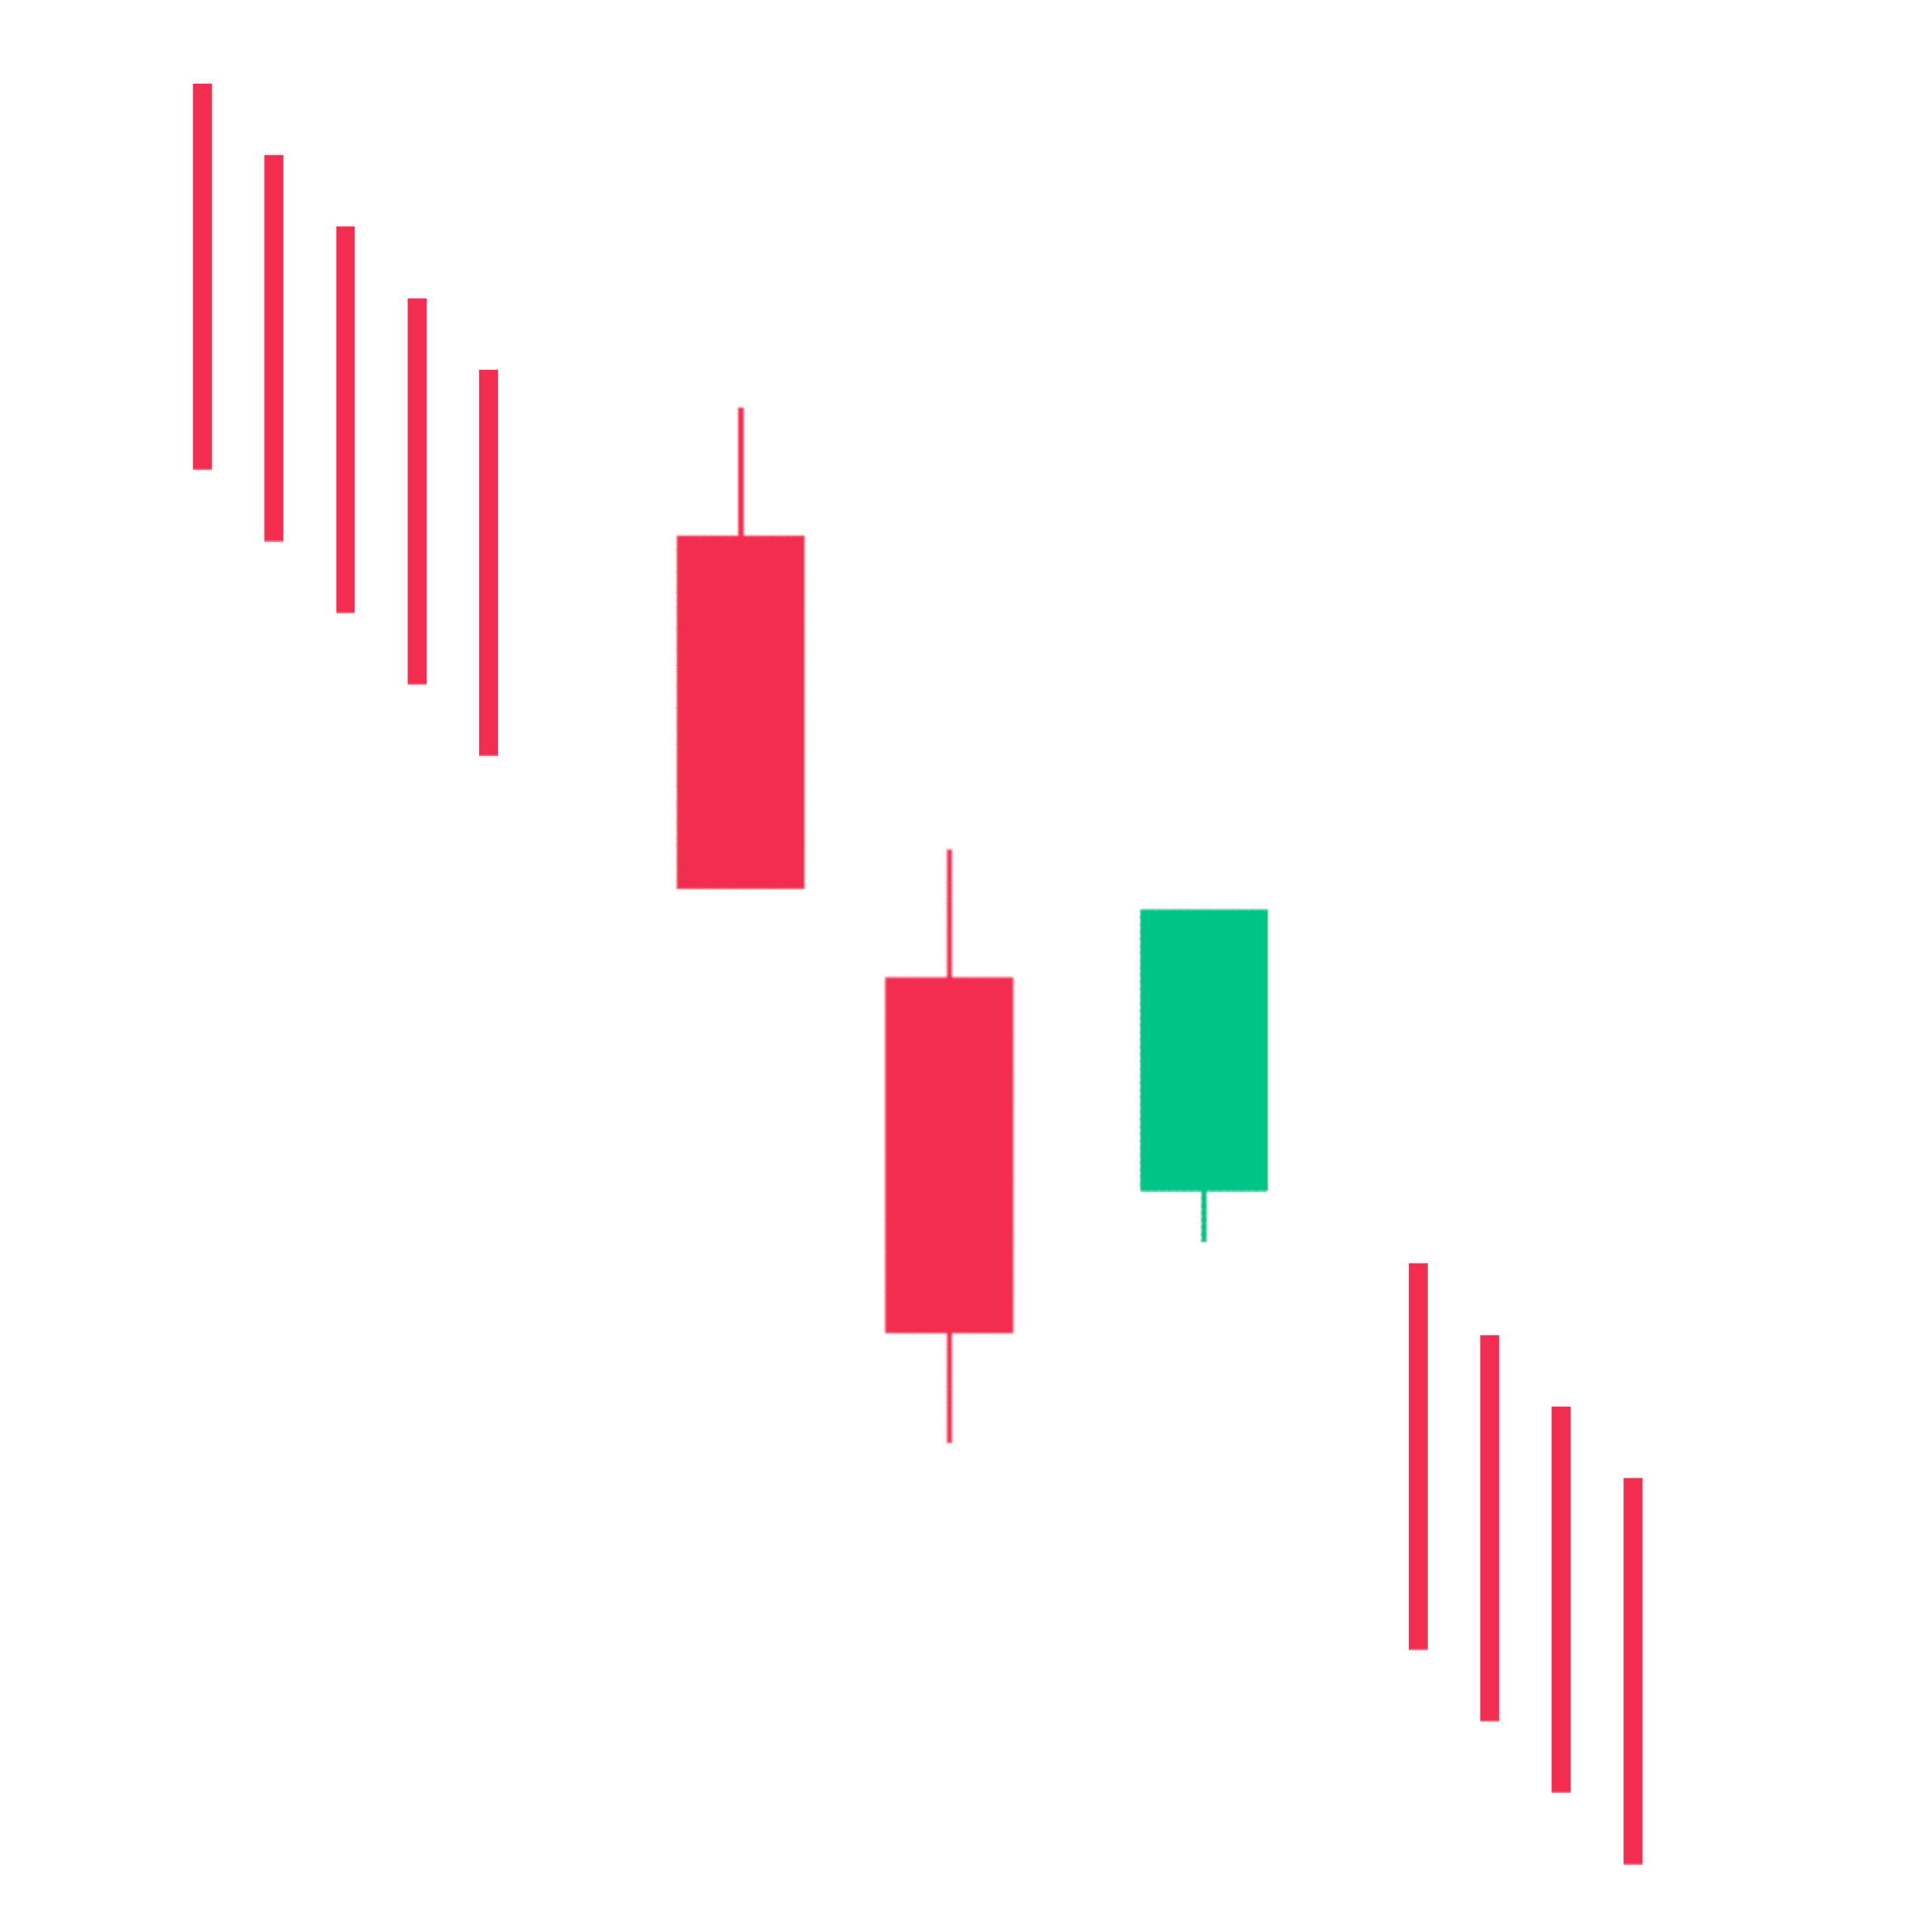
6. Three Black Crows
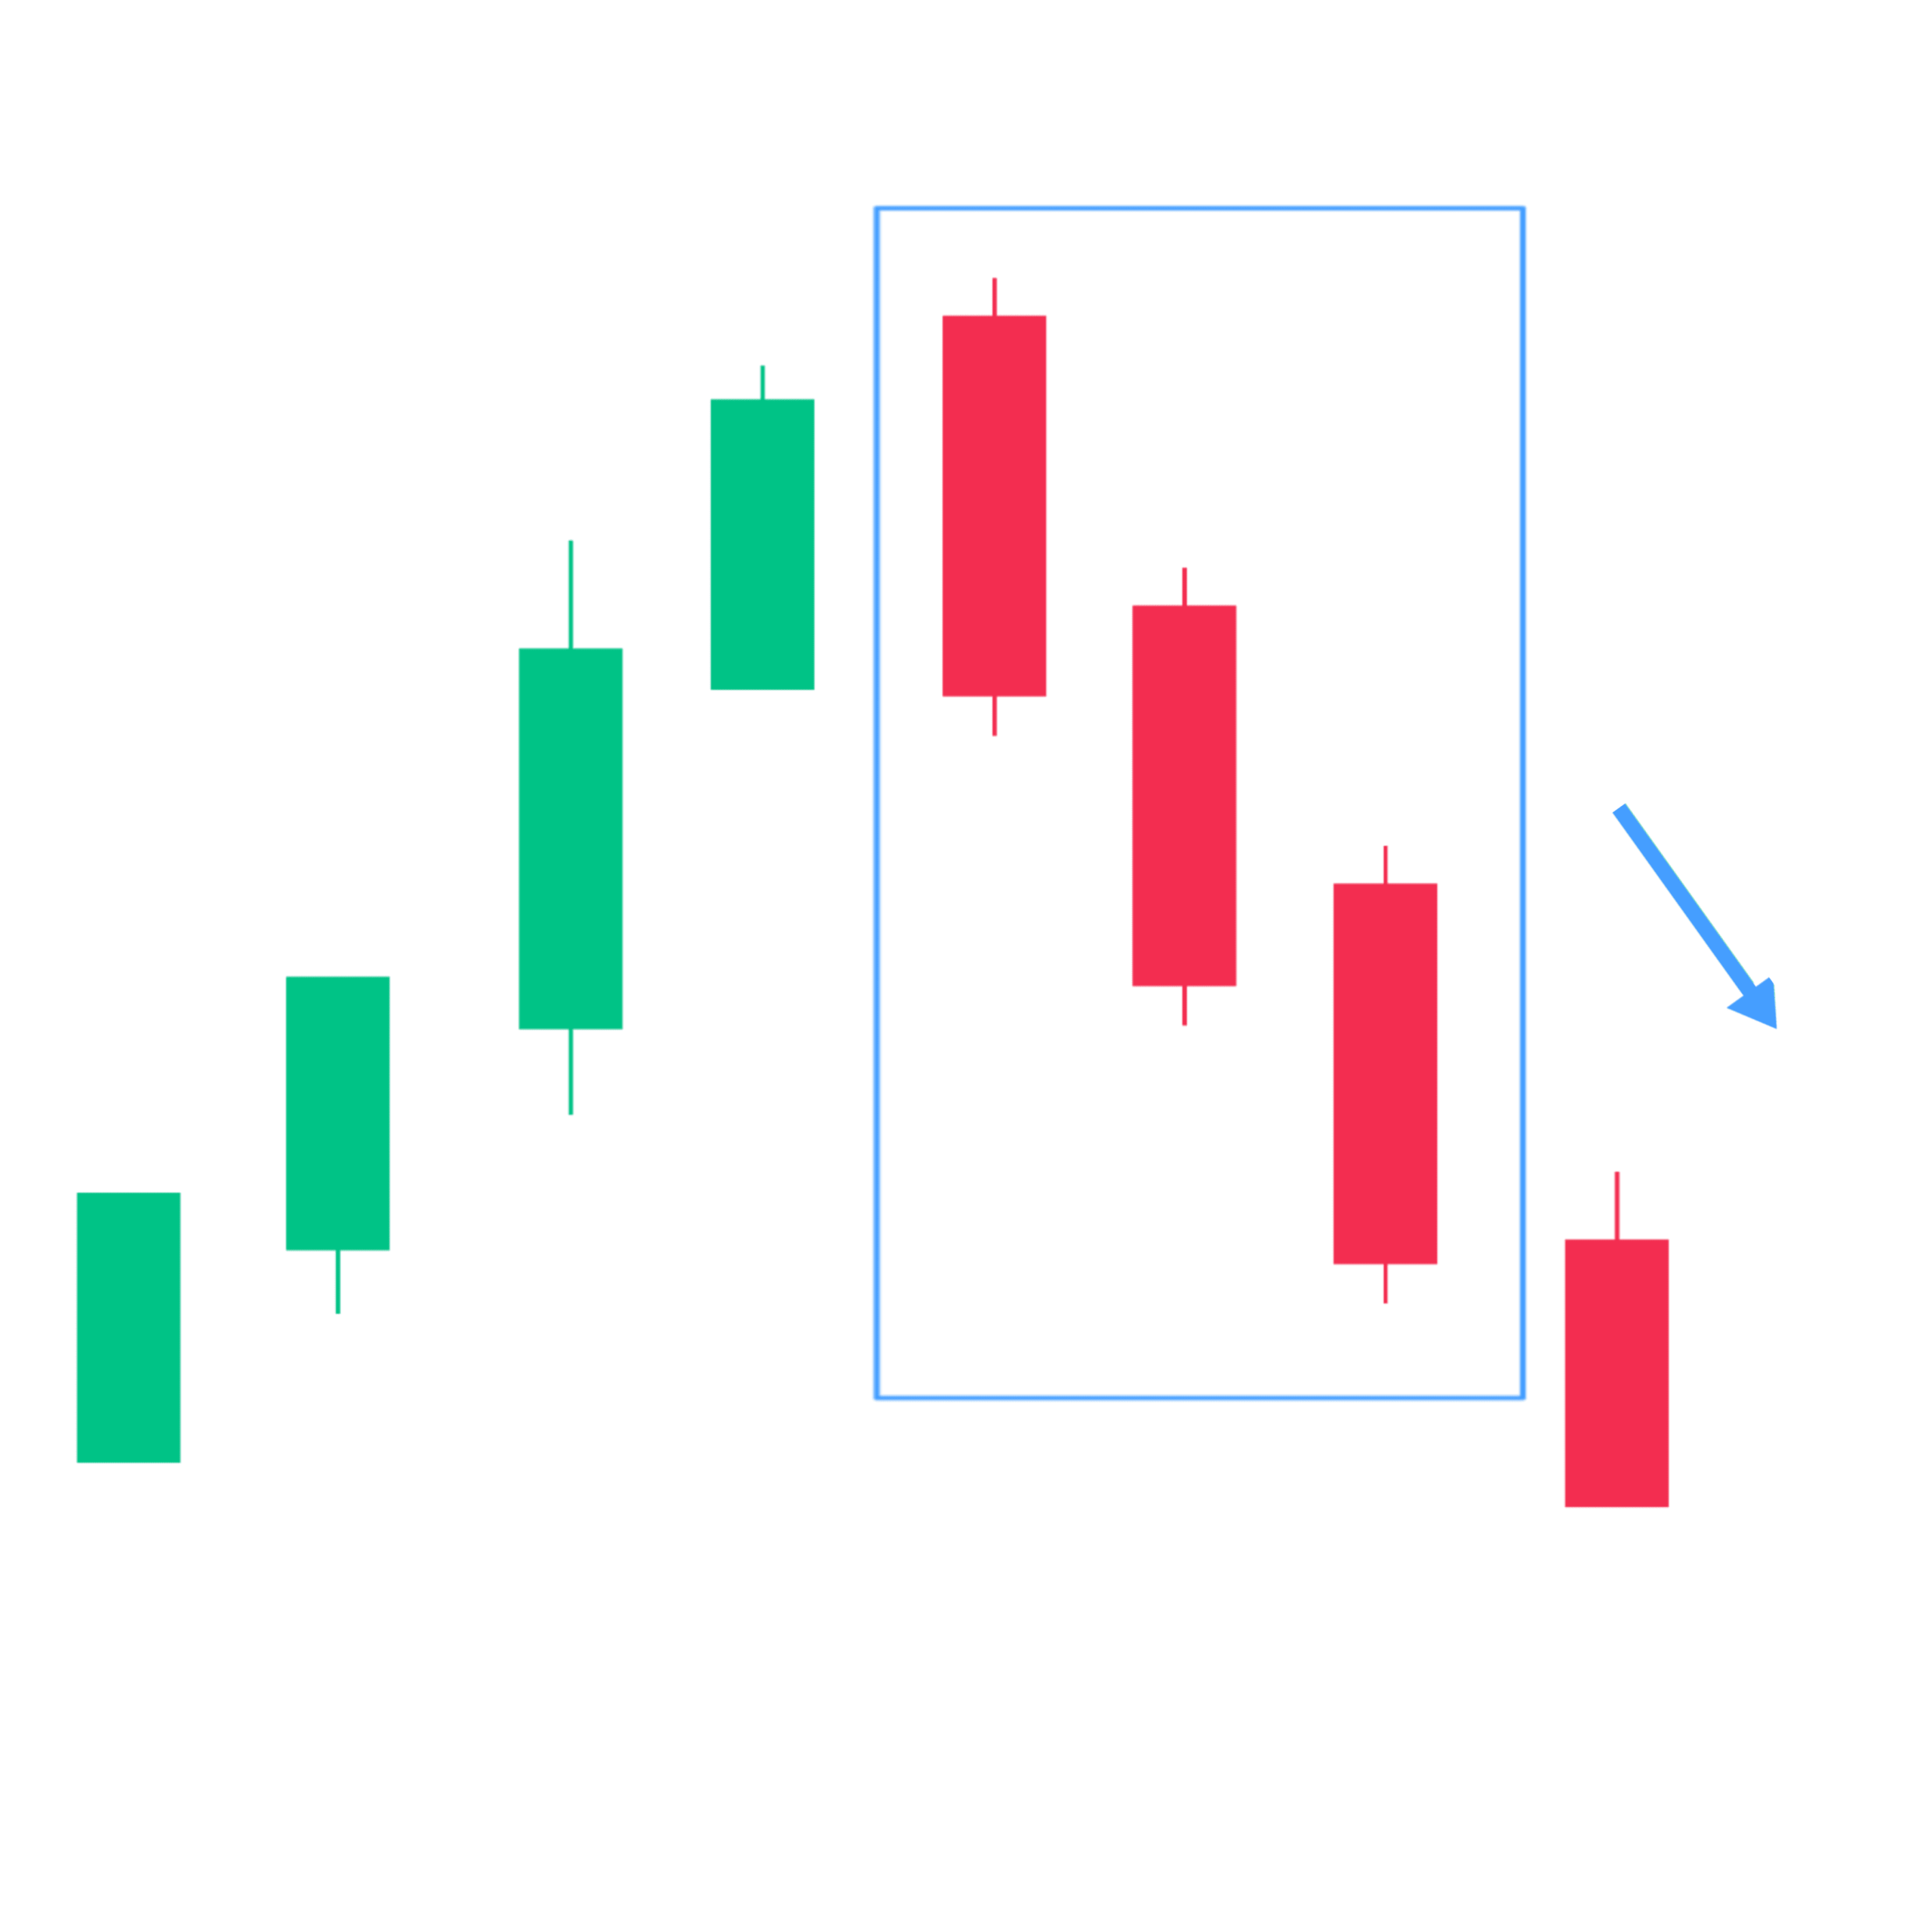
Three black crows is a three-candle pattern that includes three red candles with small wicks. These candles open and close lower than the previous candle.
In an uptrend, this is a strong indication of steady selling pressure.
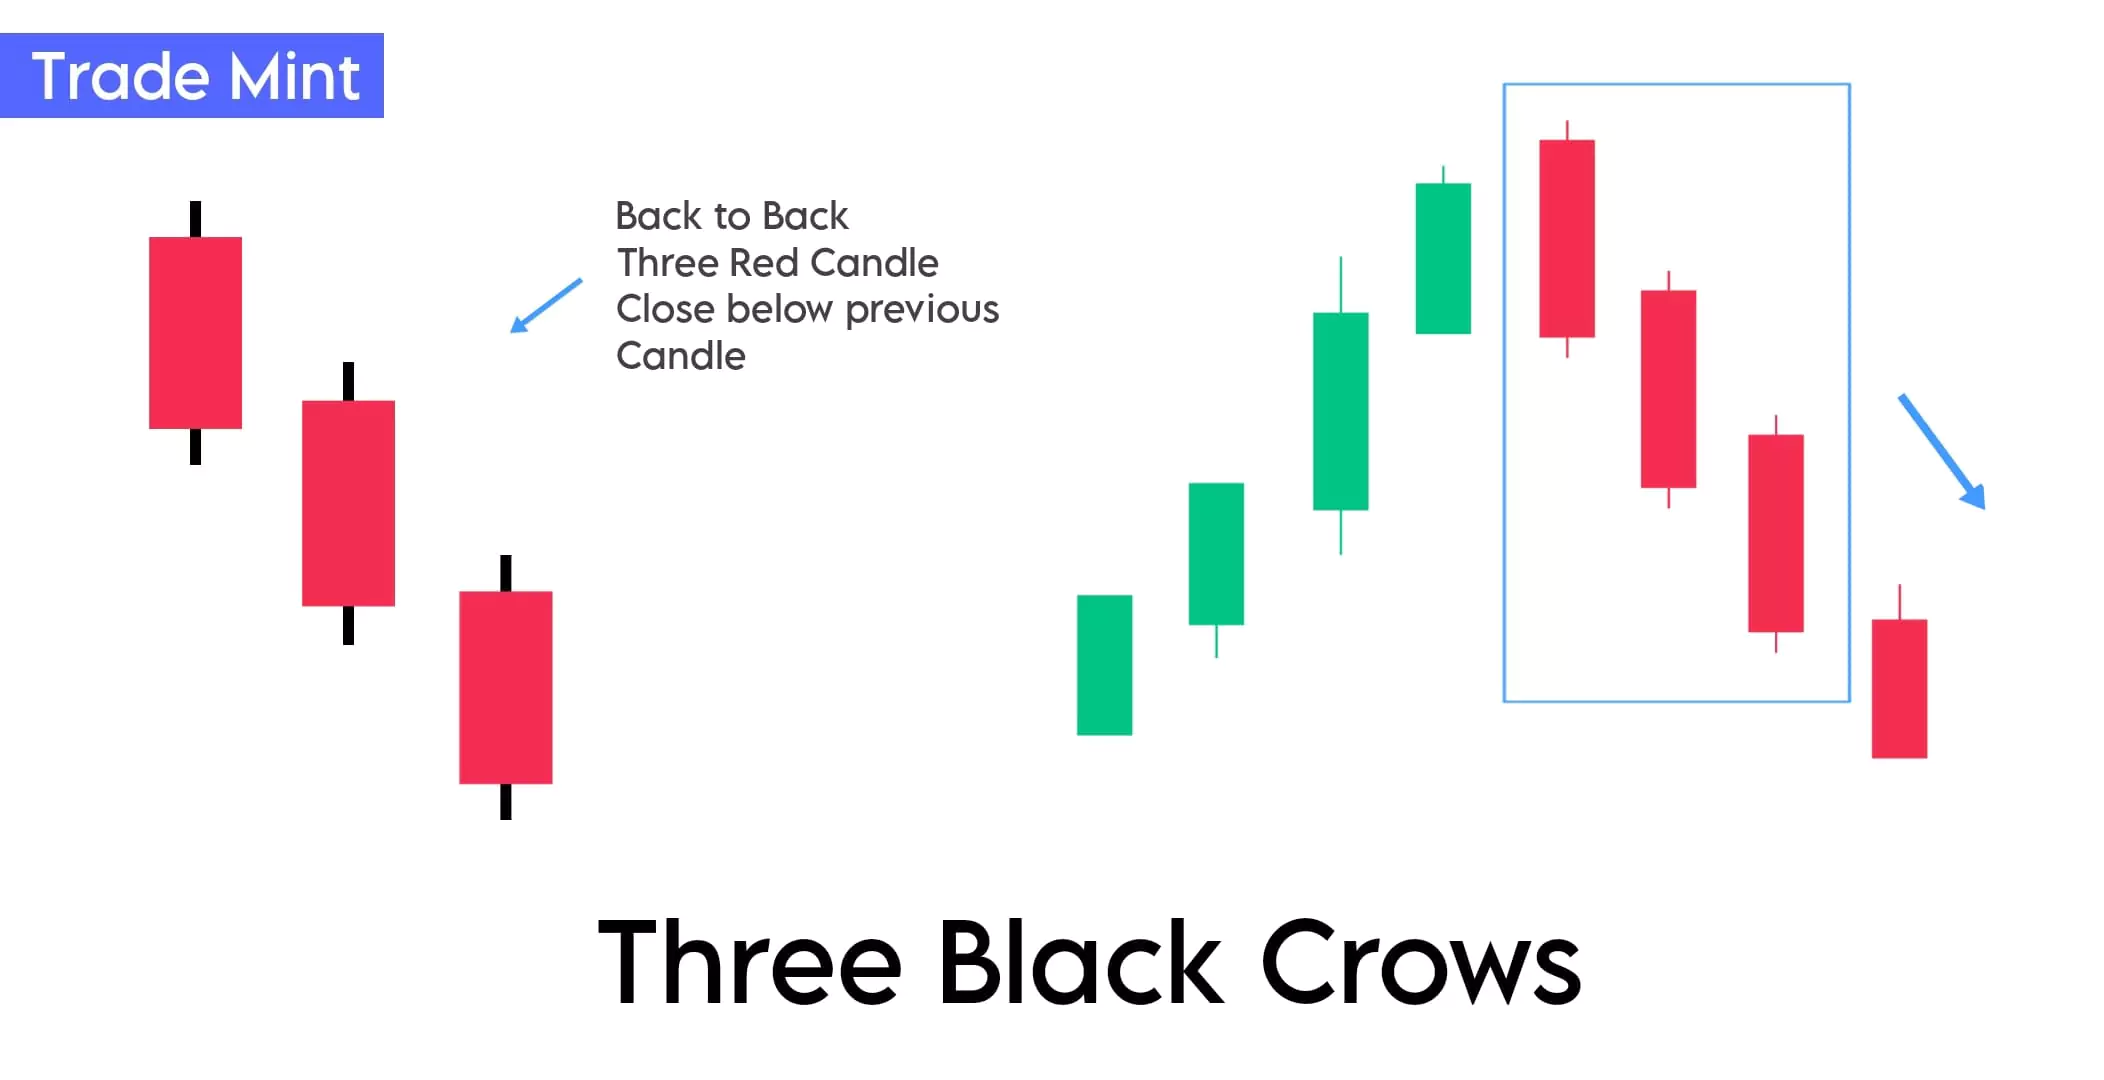
The black crow pattern is a bearish reversal pattern, consisting of three consecutive long red (Black) candlesticks with small wicks. Each candle opens and closes below the previous candle, and the pattern suggests a shift in market sentiment from bullish to bearish.
This pattern creates a series of lower highs and lower lows, highlighting the increasing power of sellers.
Three black crows indicate a high probability of a trend reversal to the downside.
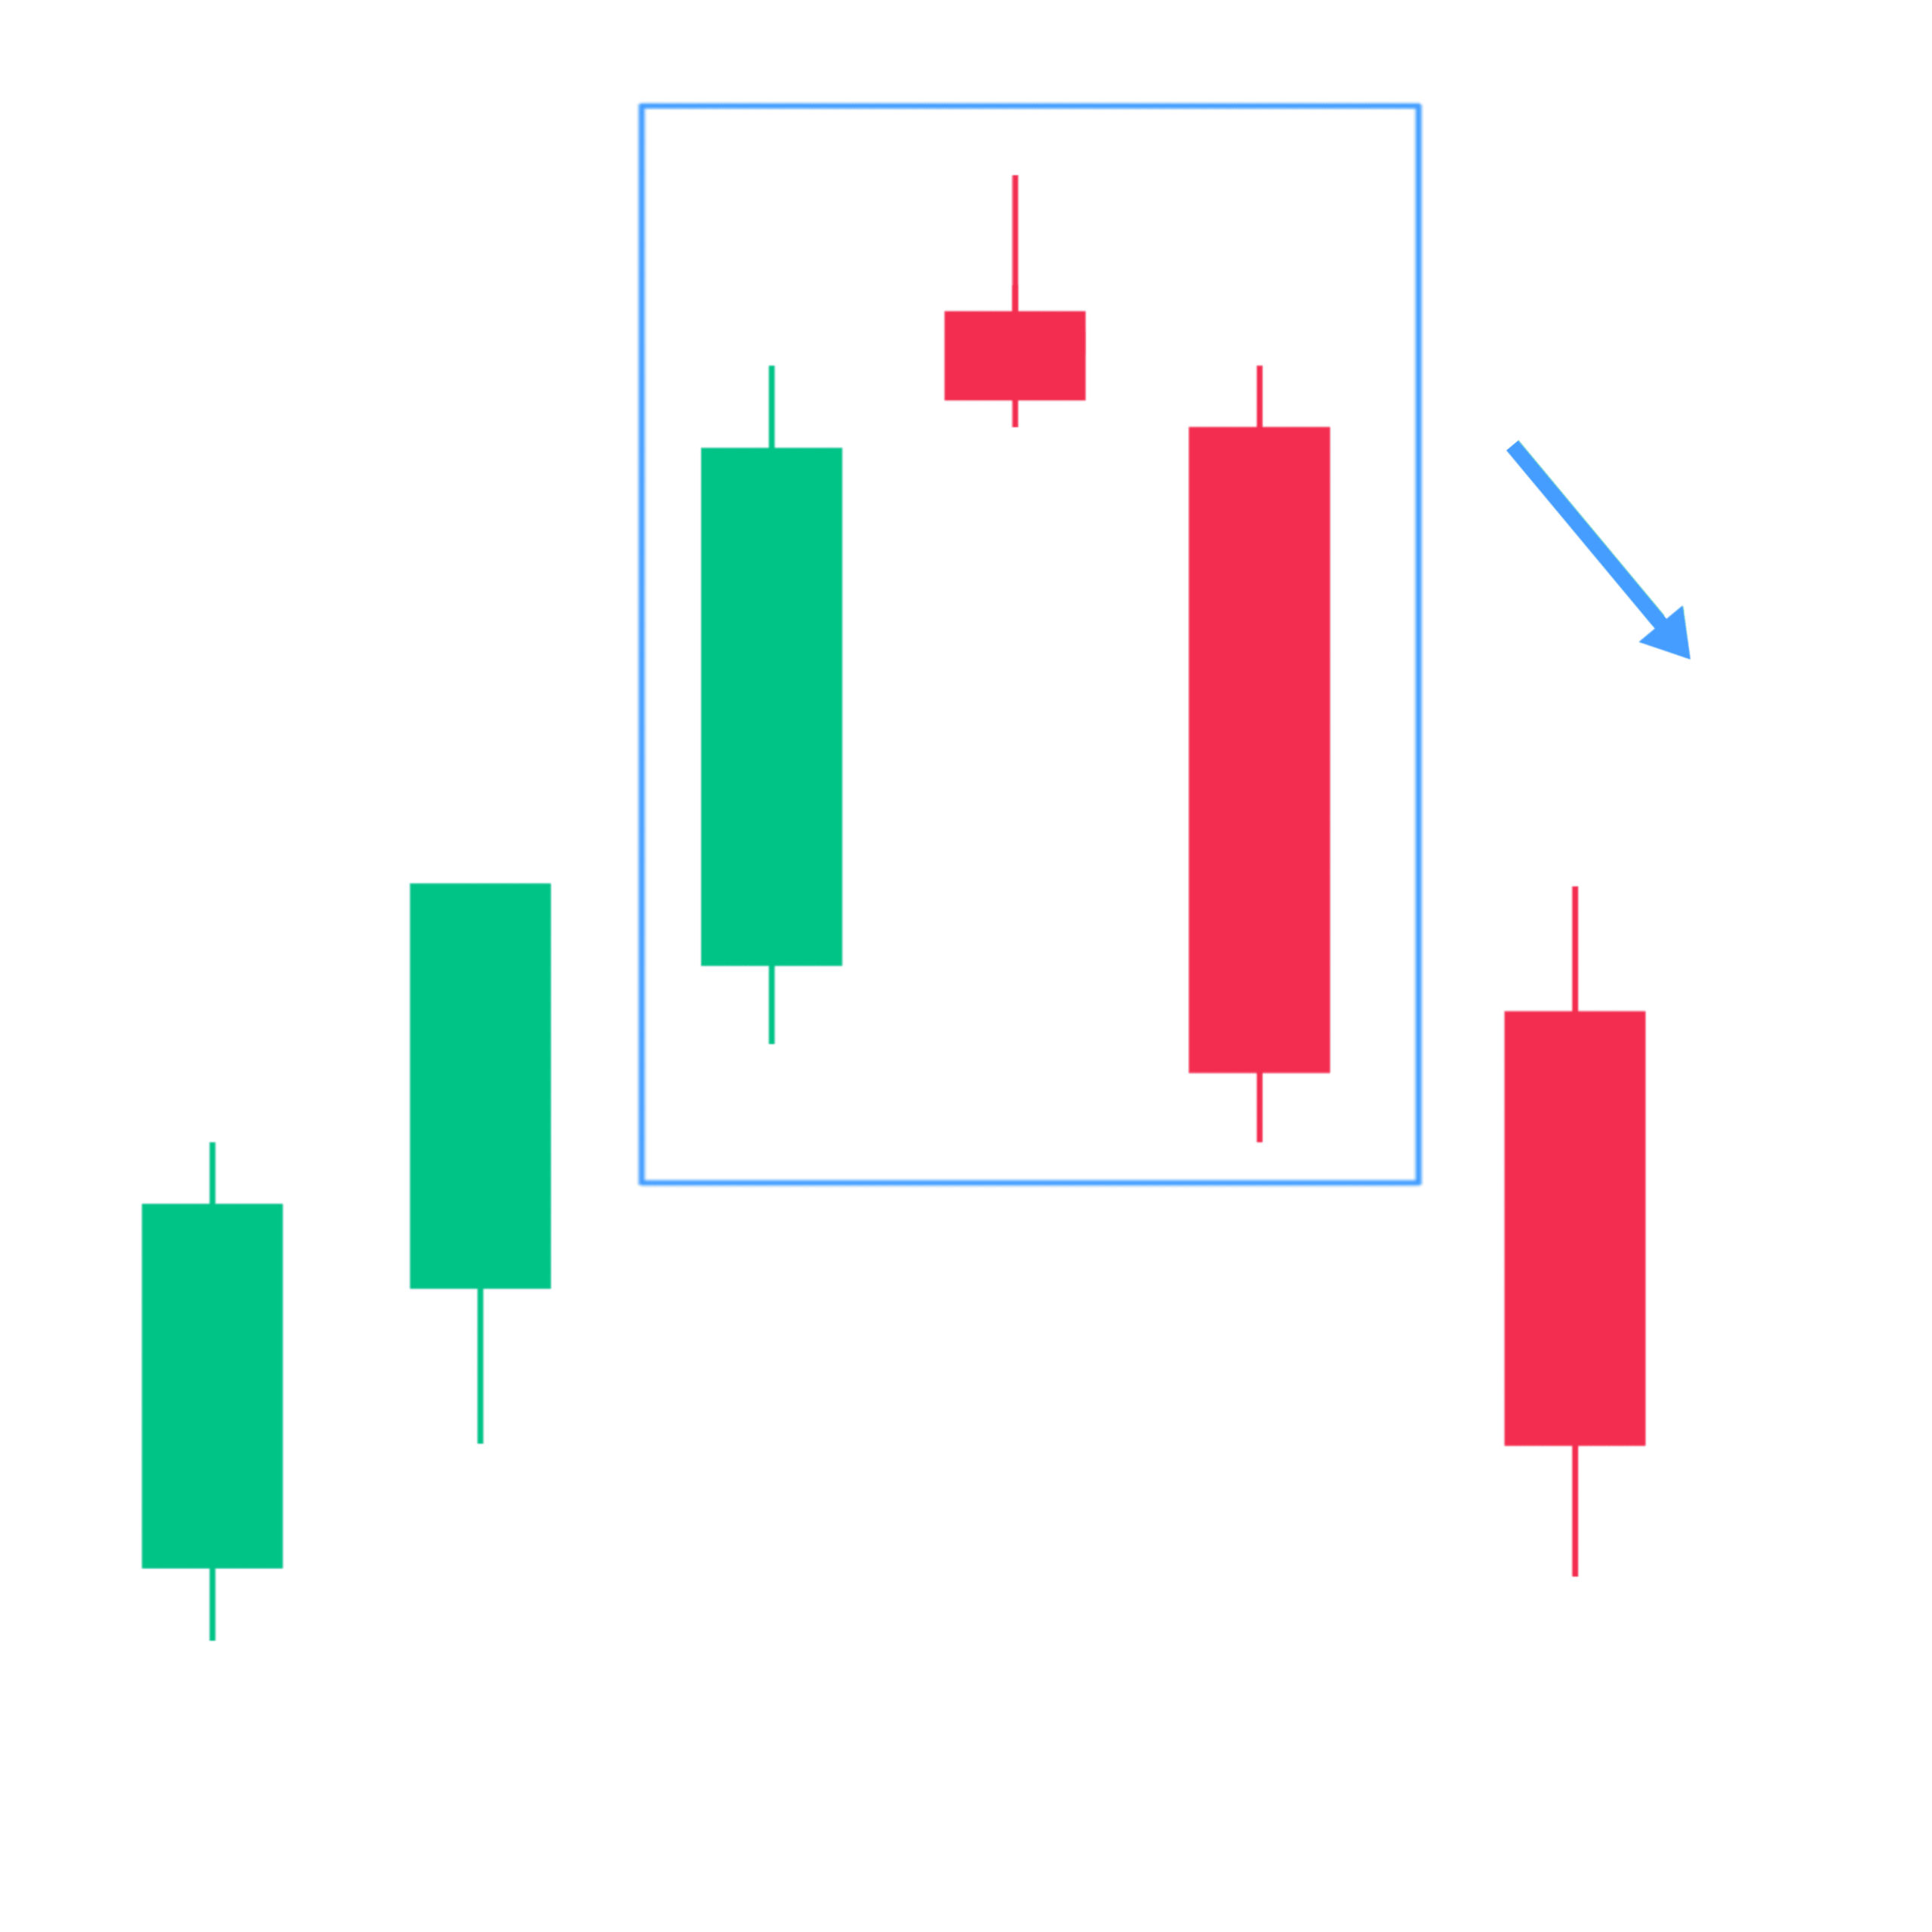
7. Evening Star
The Evening Star is a bearish reversal candlestick pattern that shows at the top of an uptrend, signaling a potential change in market sentiment from bullish to bearish. It consists of three candles and is considered a strong indication of a reversal.
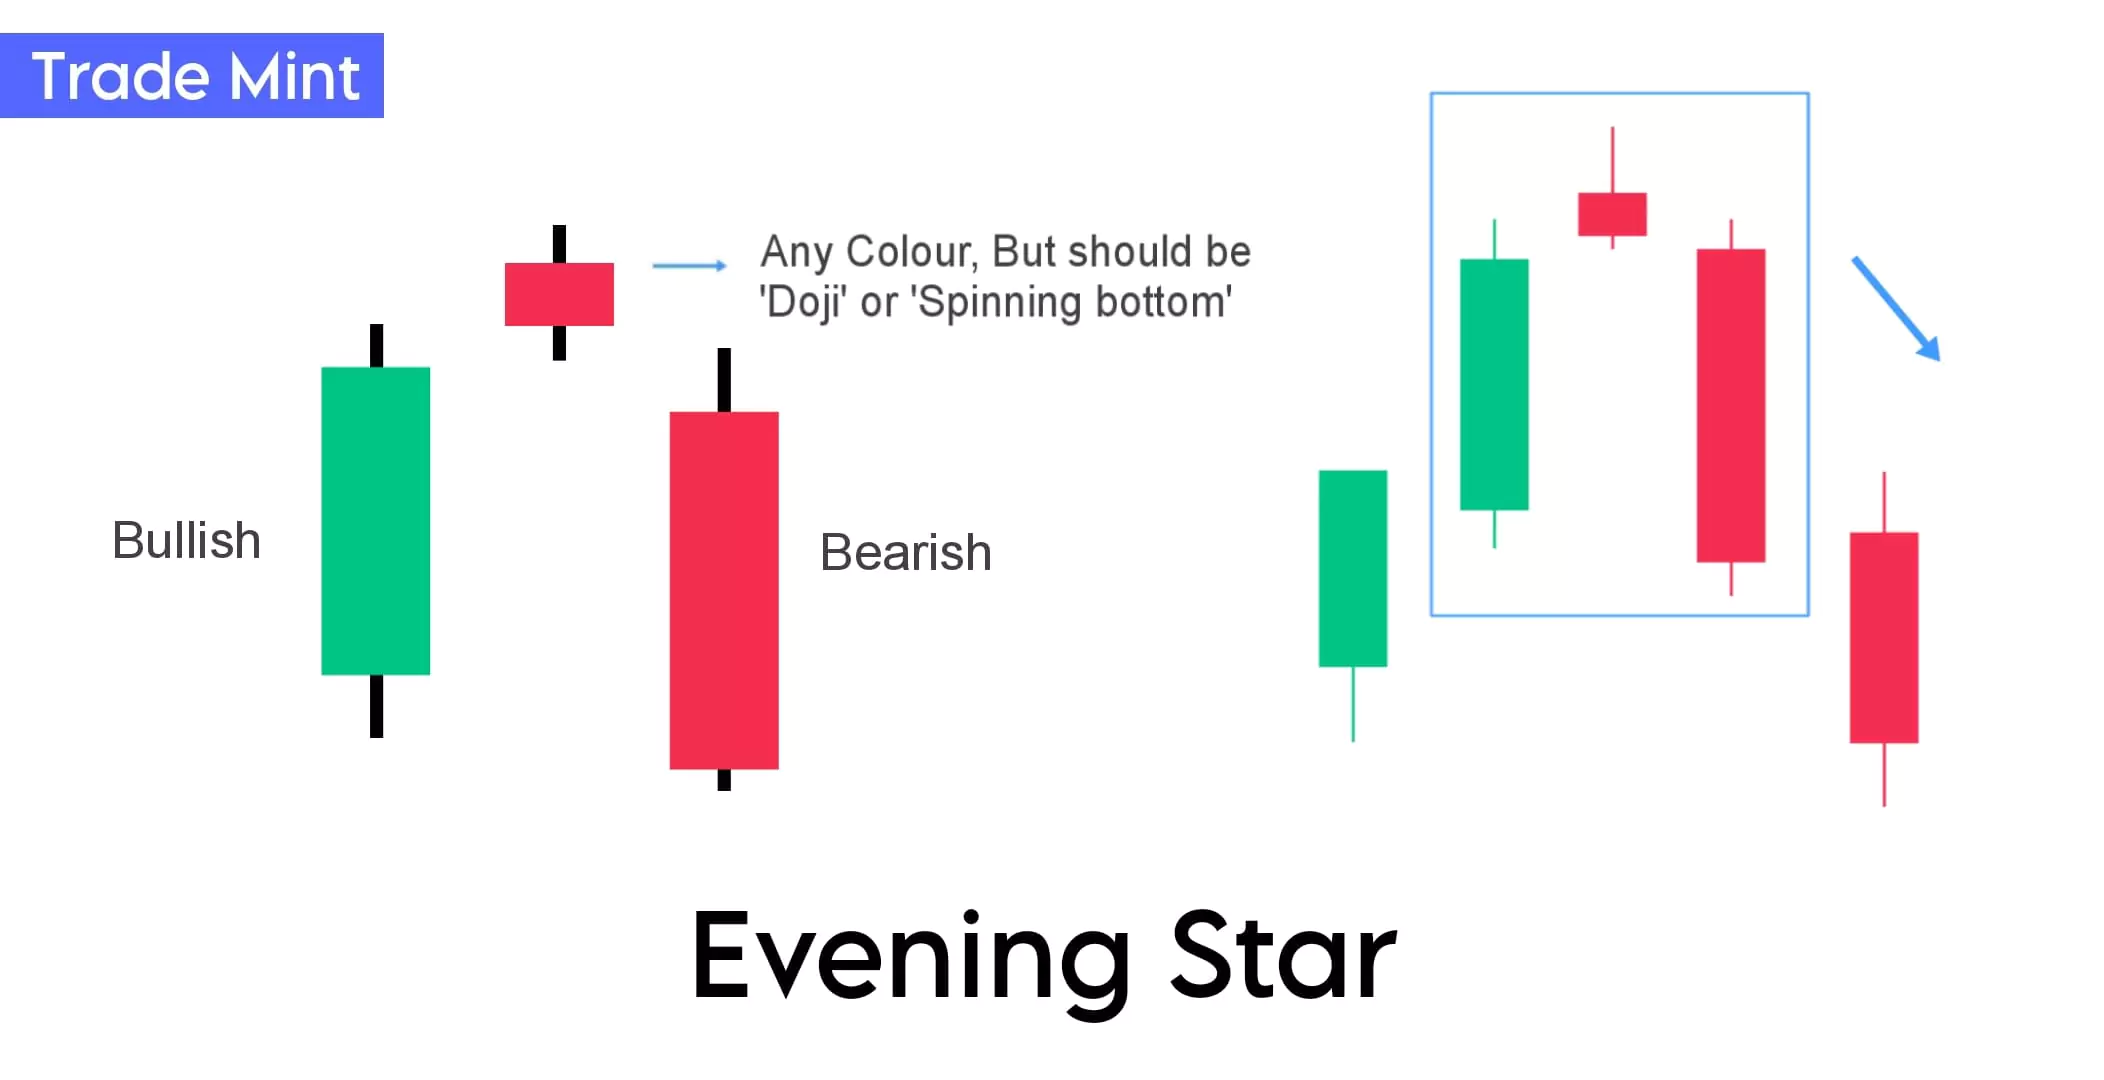
“The Evening Star candlestick pattern is a three-candlestick pattern that signifies bearish sentiment in the market and shows the potential reversal after the top of an uptrend. The first is a long bullish candle, the second is a small-bodied candle indicating indecision at the top and the third one is a strong bearish candle that shows now change the market sentiment.”
The first candle represents a strong uptrend, the second shows indecision or potential reversal, and the third confirms the bearish reversal signal.
The evening star is formed of a short candle sandwiched between a long green candle and a large red candlestick.
Guide: Traders should enter into short positions only after the confirmation of the third candle closing below the first one and it completely shows selling pressure. Now, a stop-loss can be placed at the top of the second candle.
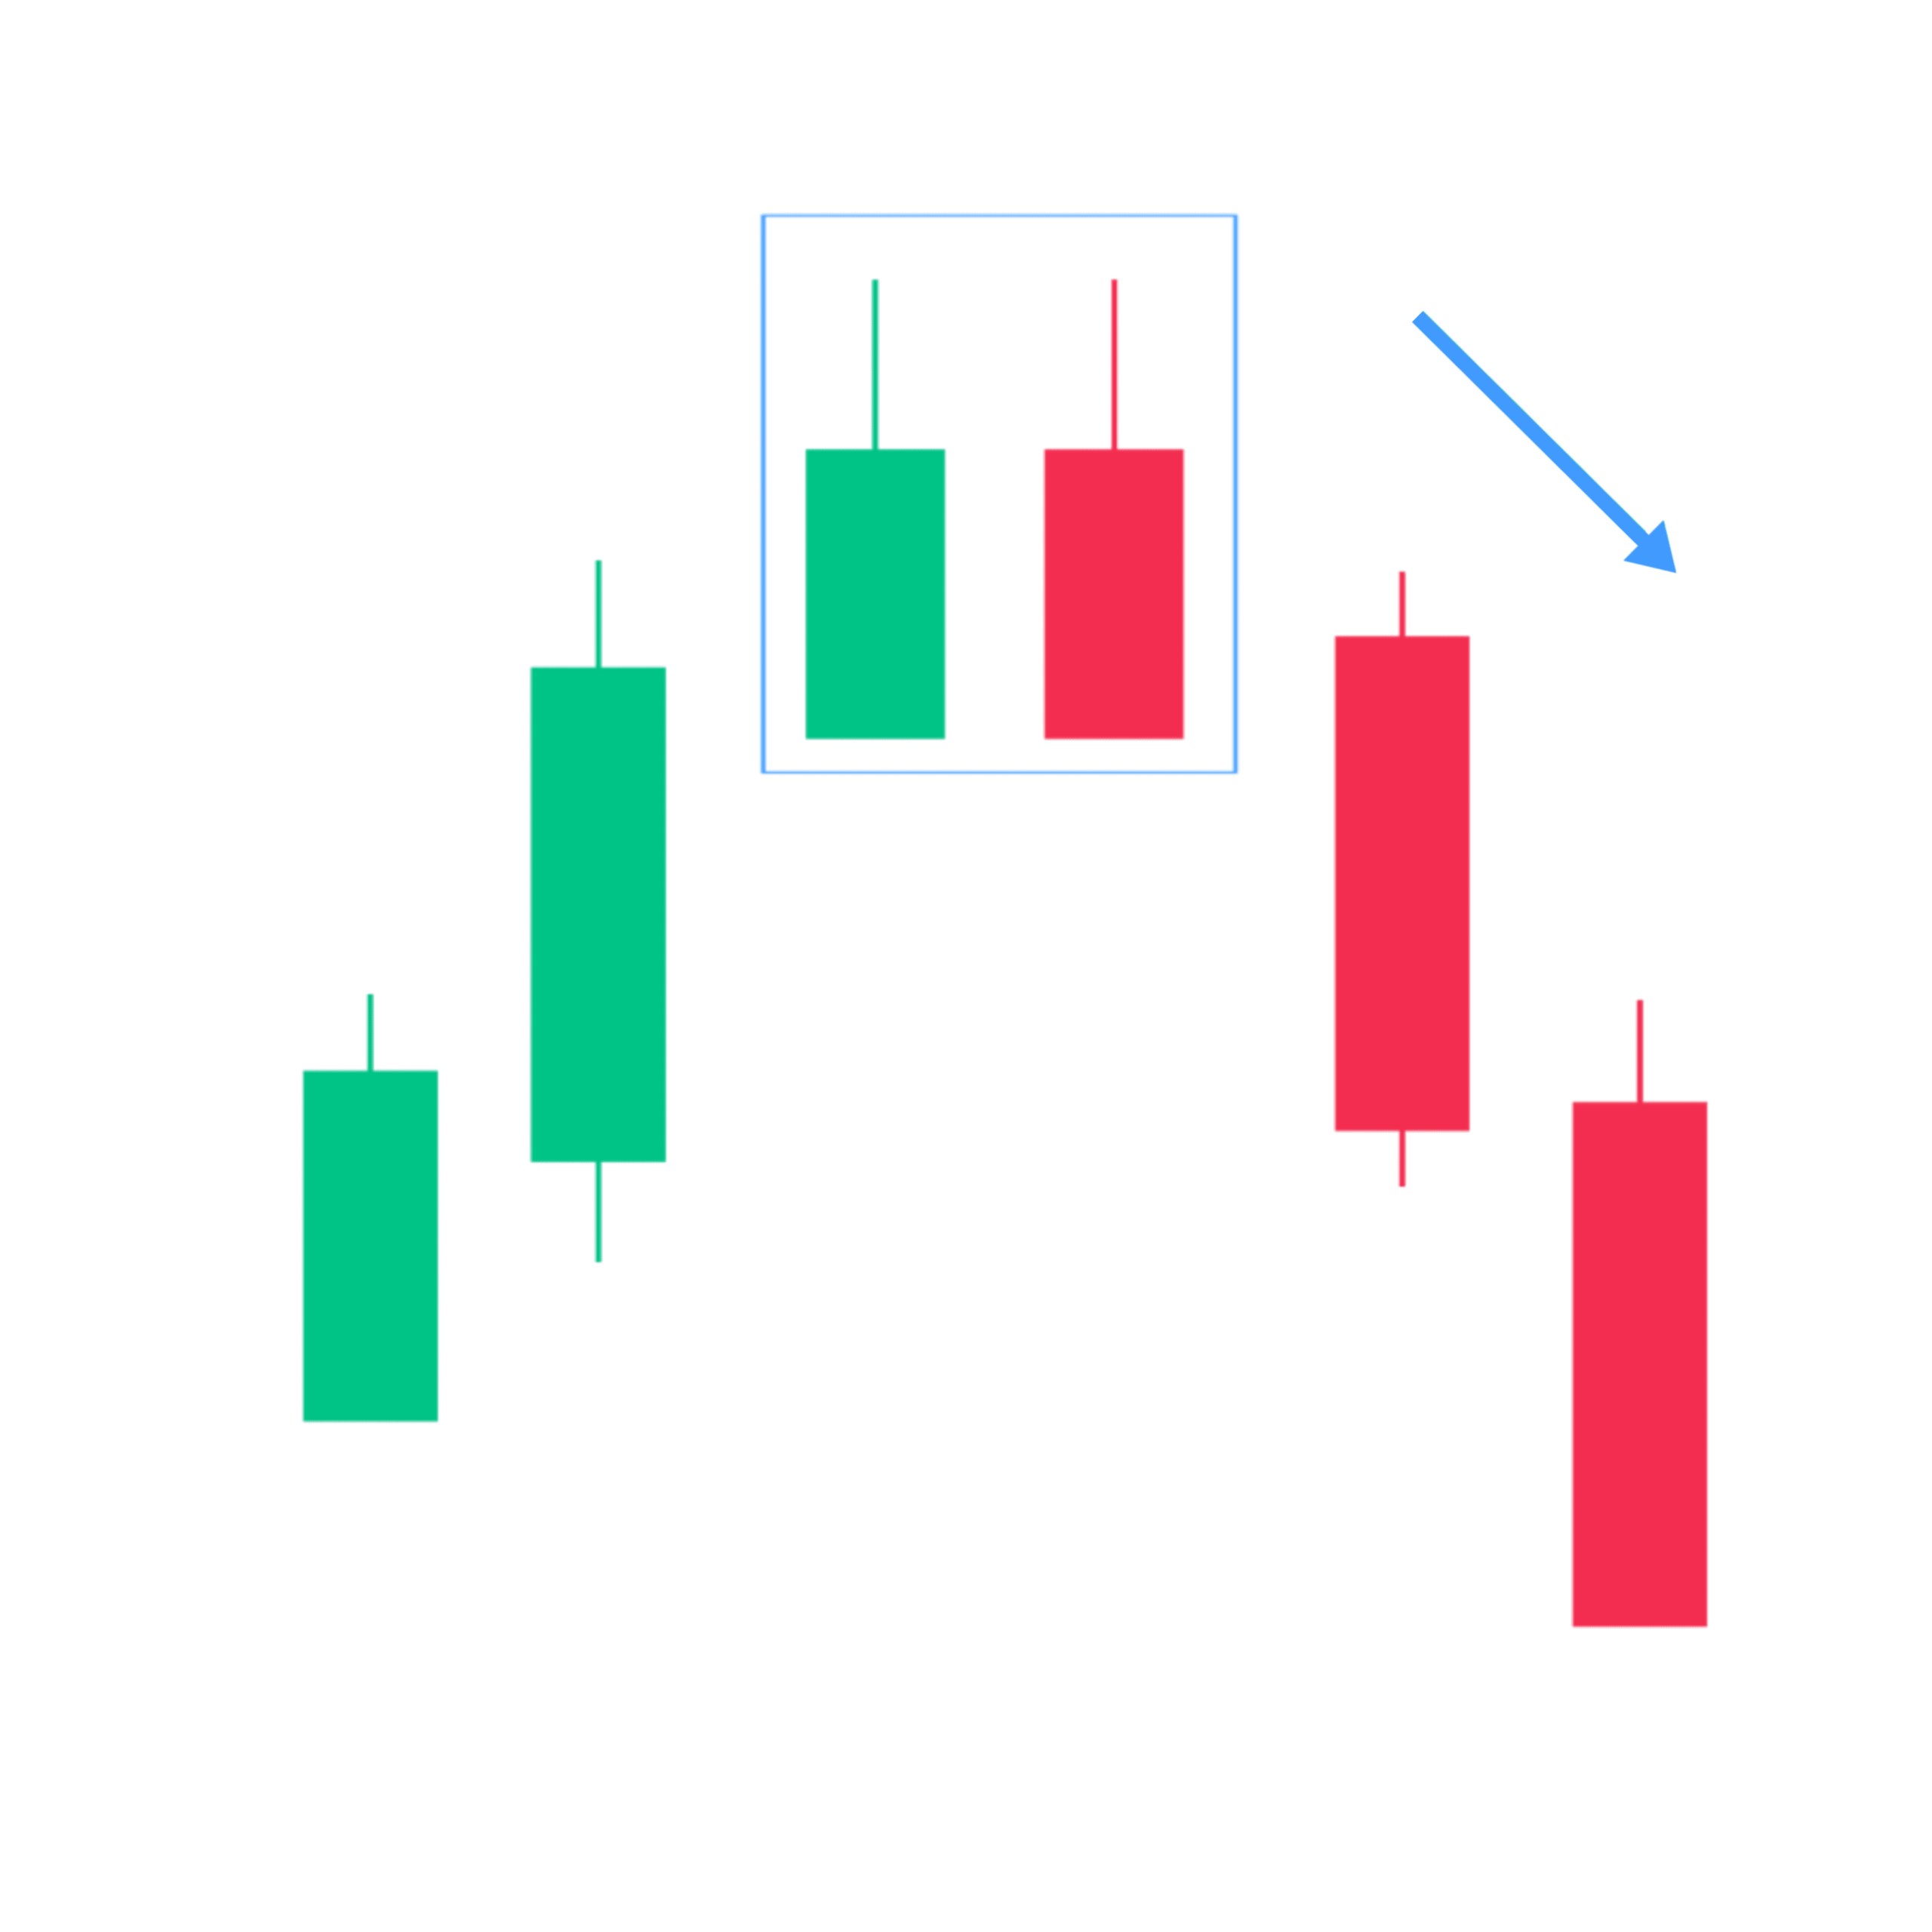
8. Tweezer Top
Tweezer Top is a bearish reversal pattern seen at the top of the chart and consists of two candlesticks with matching highs or the same low.
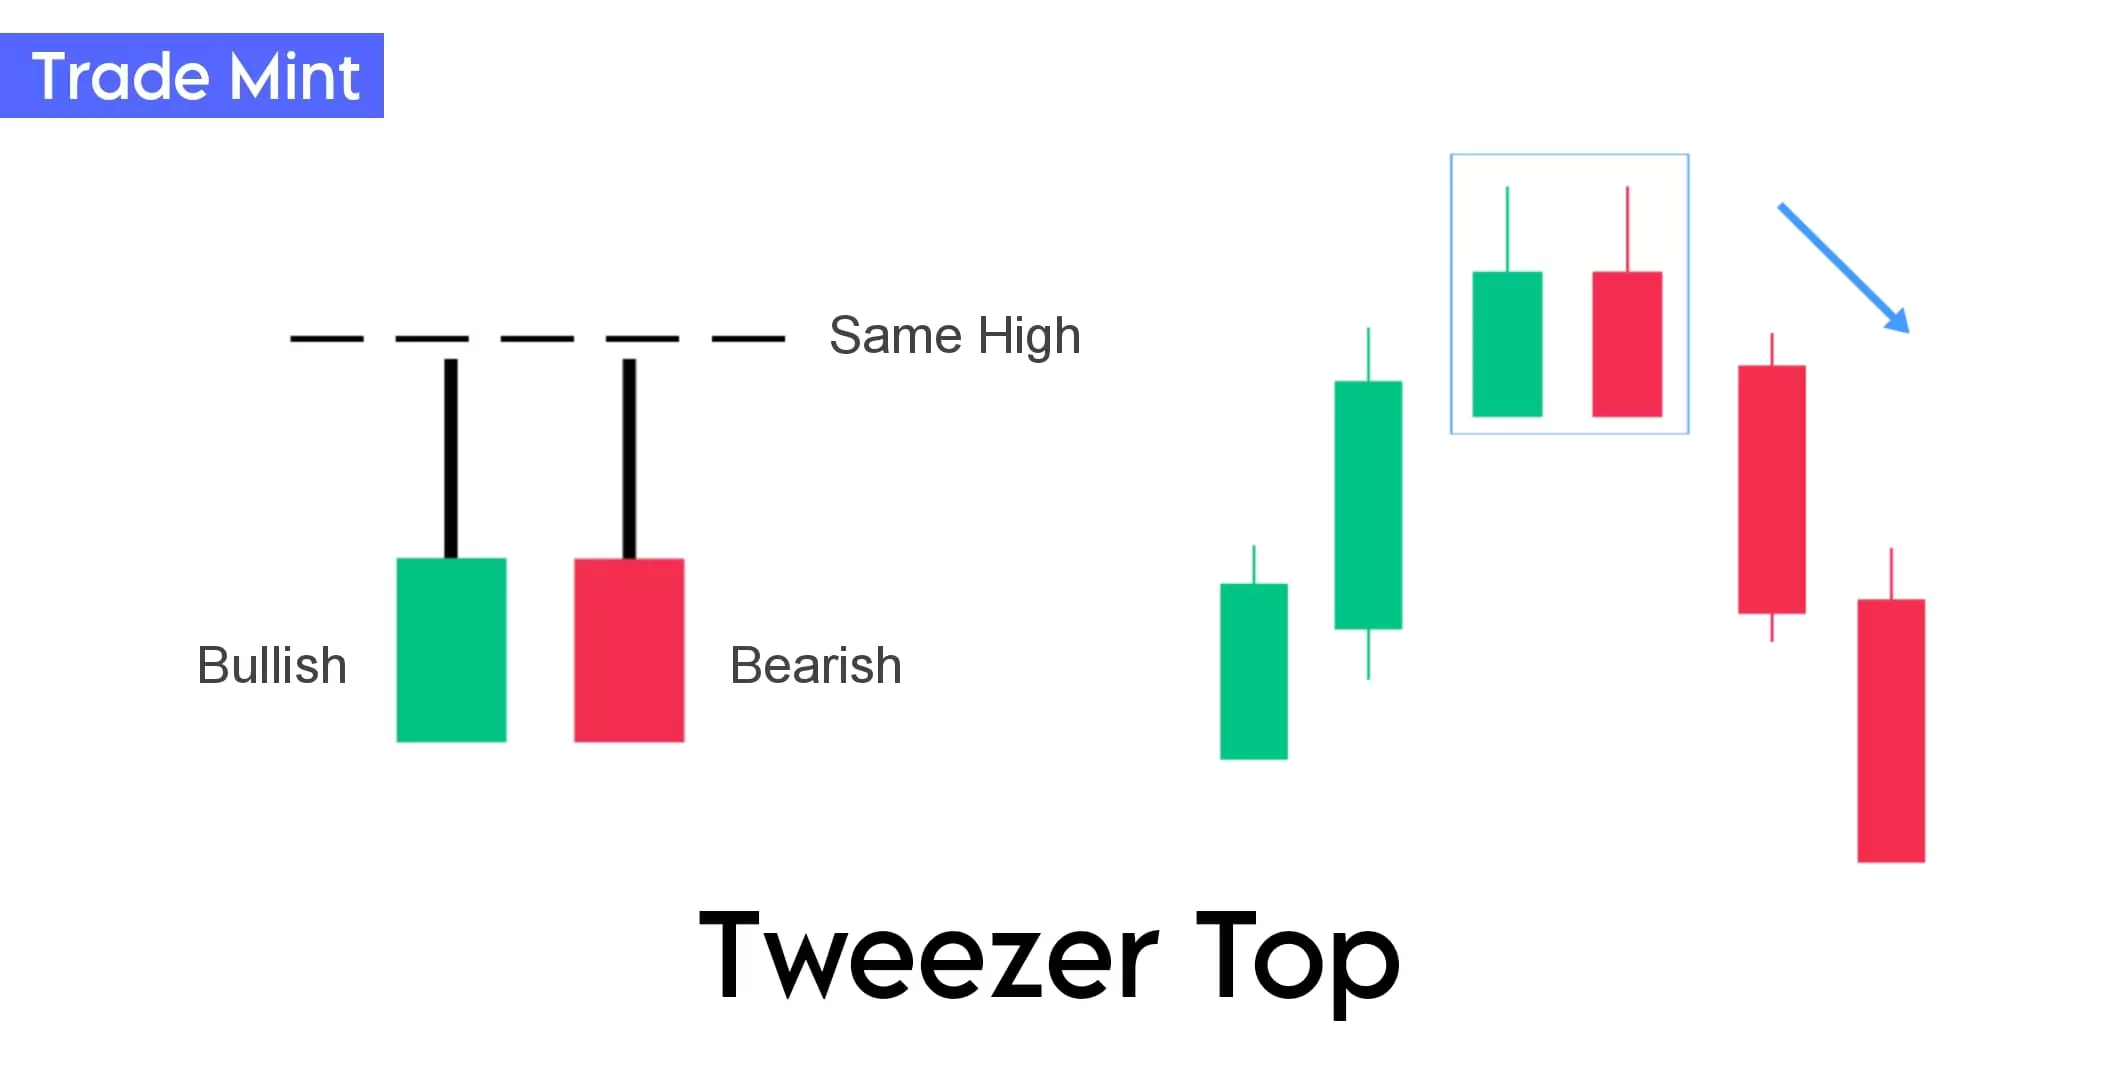
“The Tweezer Top is a bearish reversal candlestick pattern that occurs at the top of an uptrend. It forms when two consecutive candlesticks have similar or equal high, creating a pattern that looks like tweezers.”
Since two or more candles formed shadows at this same level confirms the strength of the support and shows that the uptrend has likely paused, and has reversed into a downtrend.
This pattern indicates a struggle between buyers and sellers and can signal a potential trend reversal. Traders use the Tweezer Top pattern as a signal to consider entering into short positions because This formation indicates that sellers are entering the market, as they were able to push down the market price from the high reached by the first candlestick.
9. Gravestone Doji
The gravestone doji is considered a bearish reversal pattern.
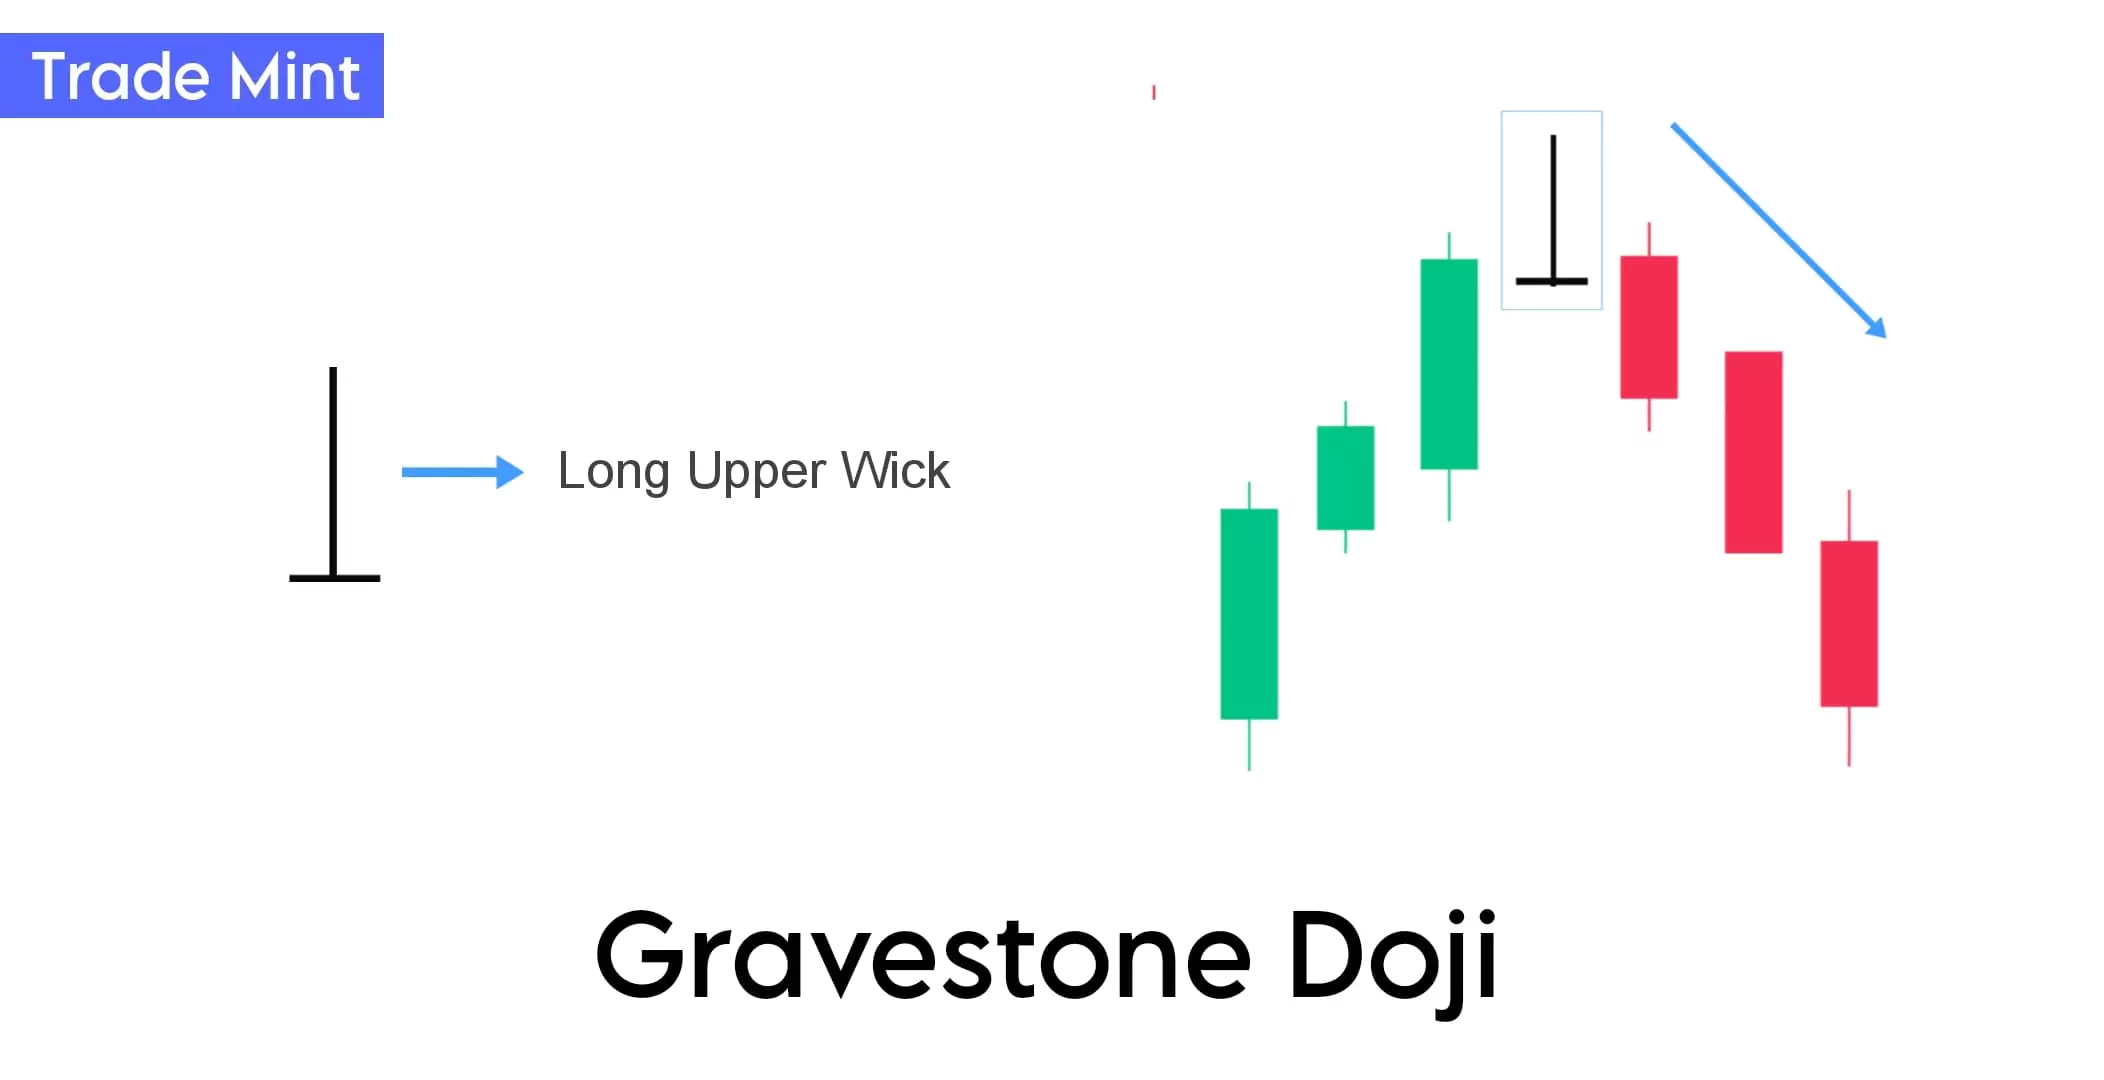
“The Gravestone Doji is a single candlestick pattern that signals a potential trend reversal, It forms when the open, high, and close prices are all the same or very close to each other with a long upper shadow.”
Gravestone Doji indicates that buyers pushed the price higher during the trading session, but at the end of the session, sellers were able to push the price back up to the opening level.
It has a long upper shadow, which extends above the opening and closing prices.
The presentation of the Gravestone Doji at the top of an uptrend signals the conclusion of the trend and shows the upswing is most certainly over.
Gravestone Doji is very similar to the bearish pin bar patterns except for the size of the body. So pin bars are more reliable.
10. Bearish Counterattack
Ah, Now the bearish counterattack pattern! That sounds like another interesting candlestick formation. So let’s break it down:

“A bearish counterattack candlestick pattern forms at the top of the uptrend. In this pattern, the first candle is green, and the second red. The second candle opens after a gap-up but closes at the closing price of the previous candle.”
The Bearish Counterattack is a two-candle pattern that signals a potential reversal from an uptrend to a downtrend. This pattern’s name derives from how the candles move in opposite directions closing like a counterattack.
The above pattern looks complicated and rare so you can refer Dark Cloud pattern is stronger than the bullish counterattack candlestick pattern.
11. Three Inside Down
Three inside down is a three-candlestick bearish reversal candlestick pattern, The first candlestick is long and bullish, indicating that the market is still in an uptrend, The second candlestick is bearish and should ideally close at the halfway below mark of the first candlestick / inside candle, and the third candlestick is also bearish and closes beyond the open of the first candle.
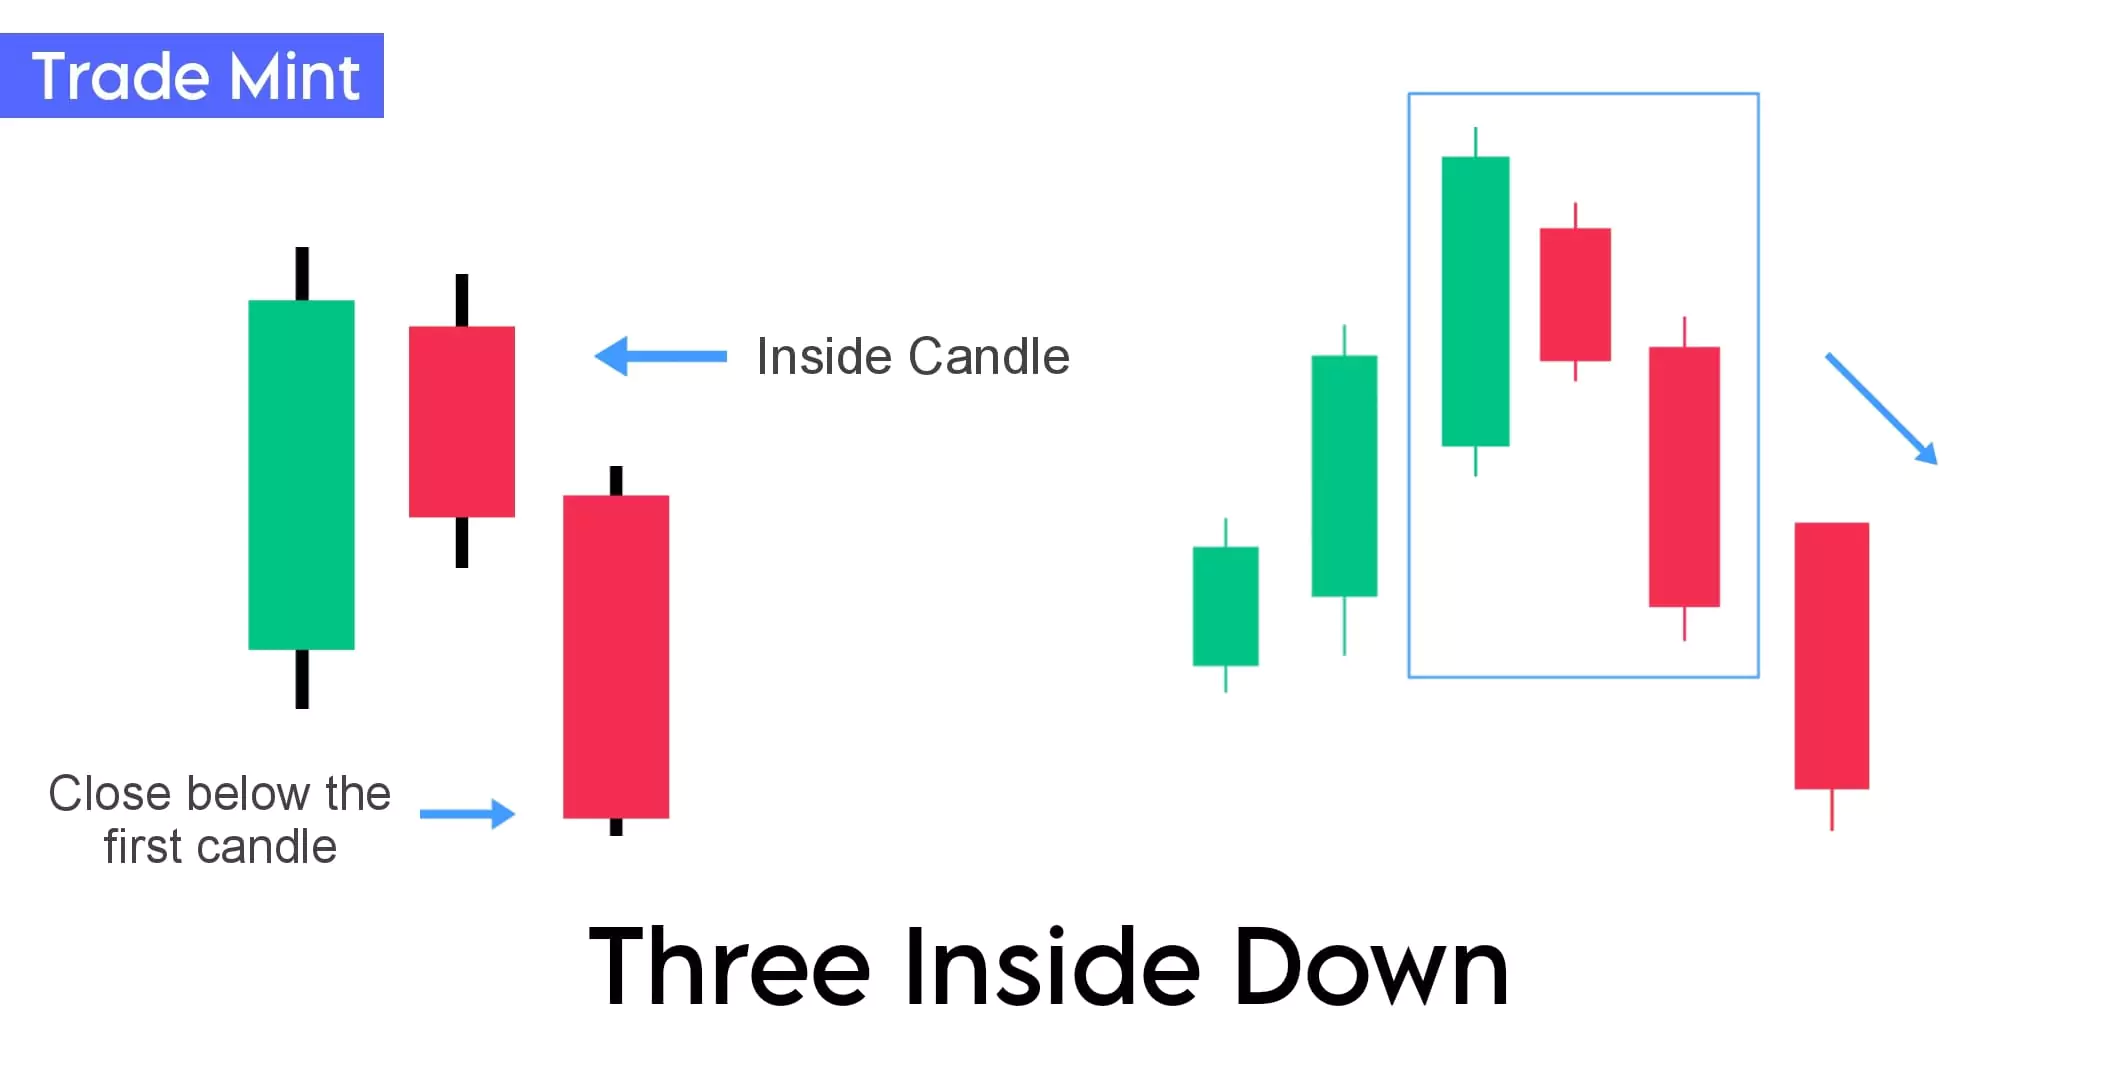
The relation of the first and second candlesticks should be of the bearish harami (Inside candle)
Guide: Traders prefer to wait for confirmation by entering only if the price moves below the low of the third candle and place a stop-loss order below the high of the second/first candle in the pattern.
Traders can take a short position after the completion of this candlestick pattern.
12. Three Outside Down
The three-outside down candlestick pattern is a three-candle bearish reversal pattern.
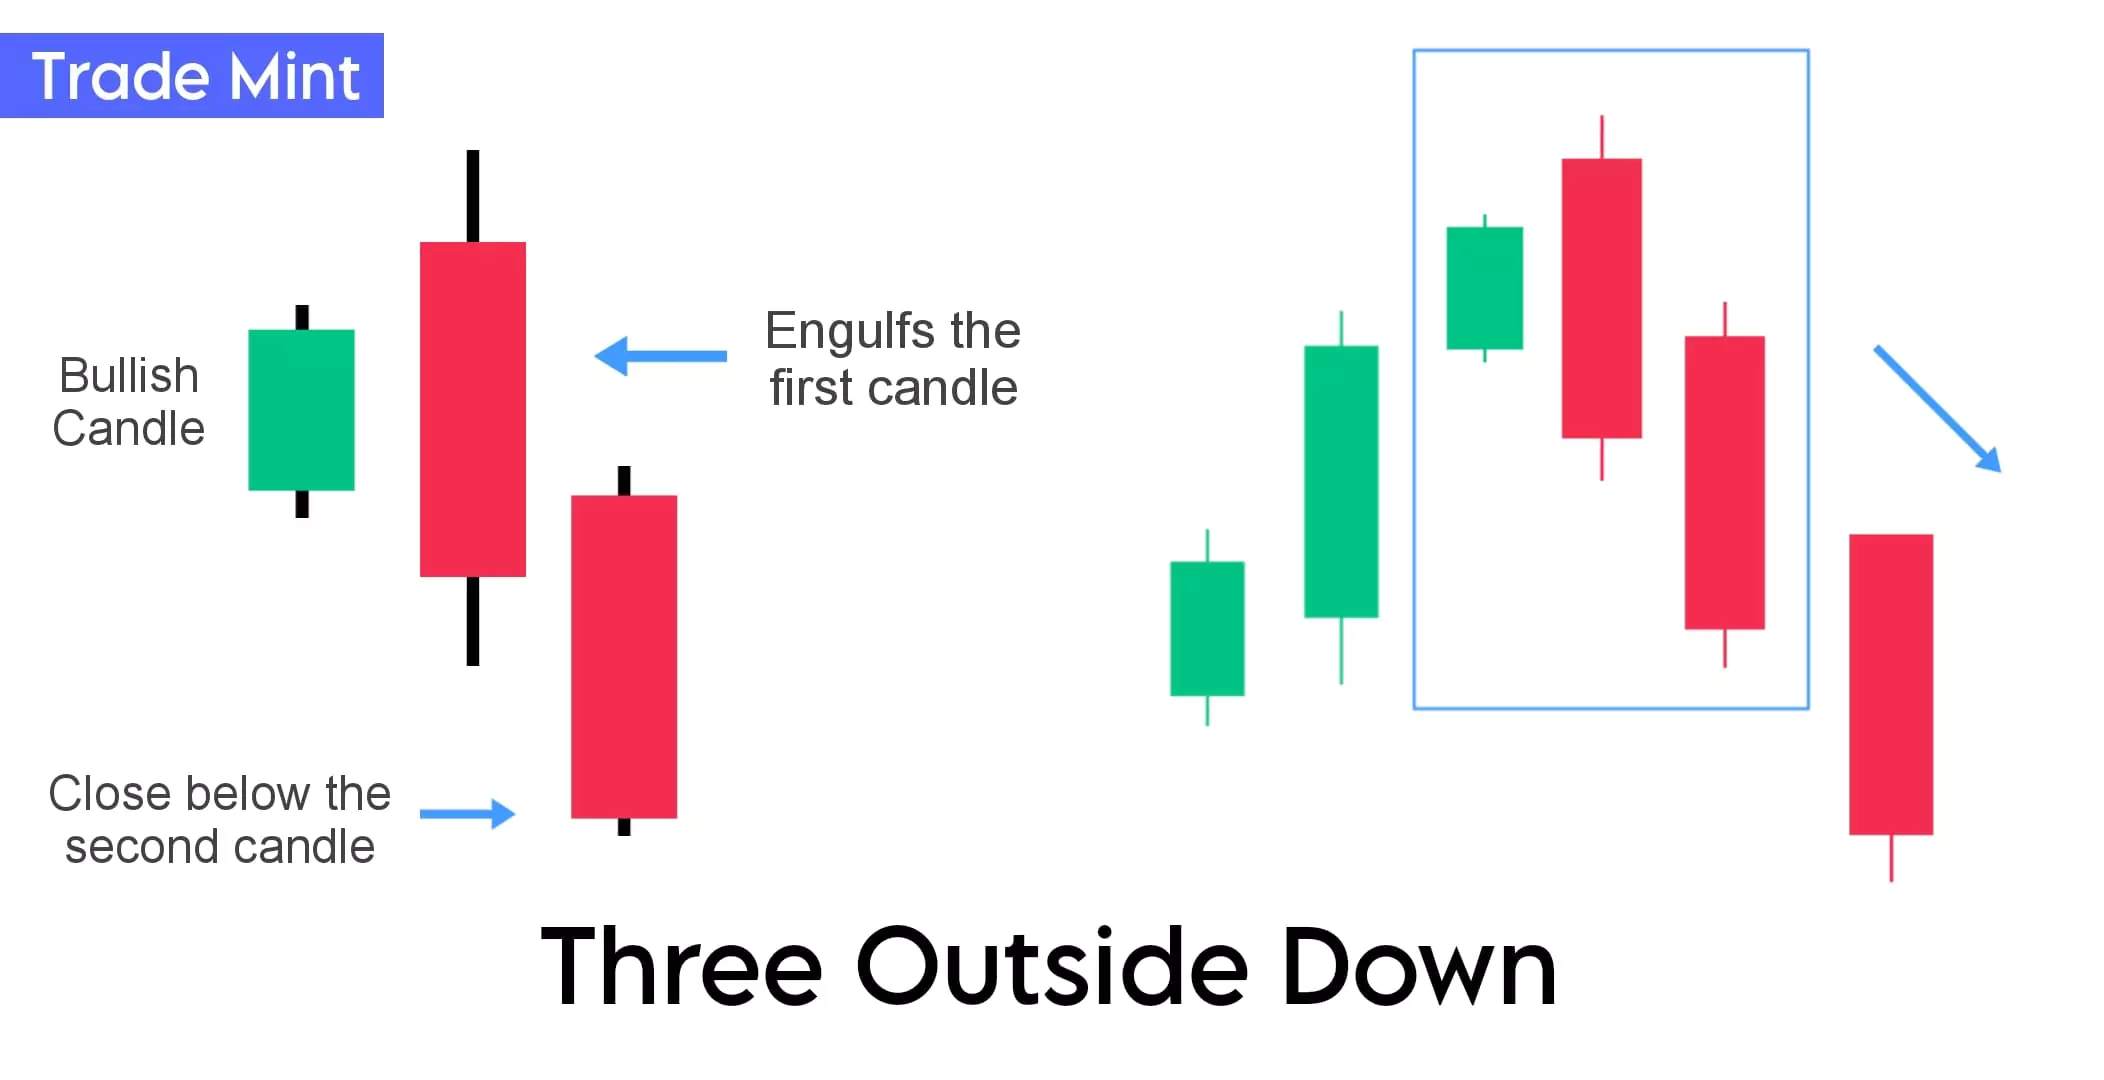
The first candle begins with a tall bullish/green candle, indicating the market is in the uptrend direction.
The second candle is a bearish/red candle that engulfs the body of the first bullish candle. This suggests a potential reversal. (Refer Engulfing Pattern)
The third candle is another bearish candle that closes lower than the low of the second candle, confirming the pattern reversal.
This is a multiple candlestick pattern so, Most of the traders enter earlier using a bearish engulfing pattern.
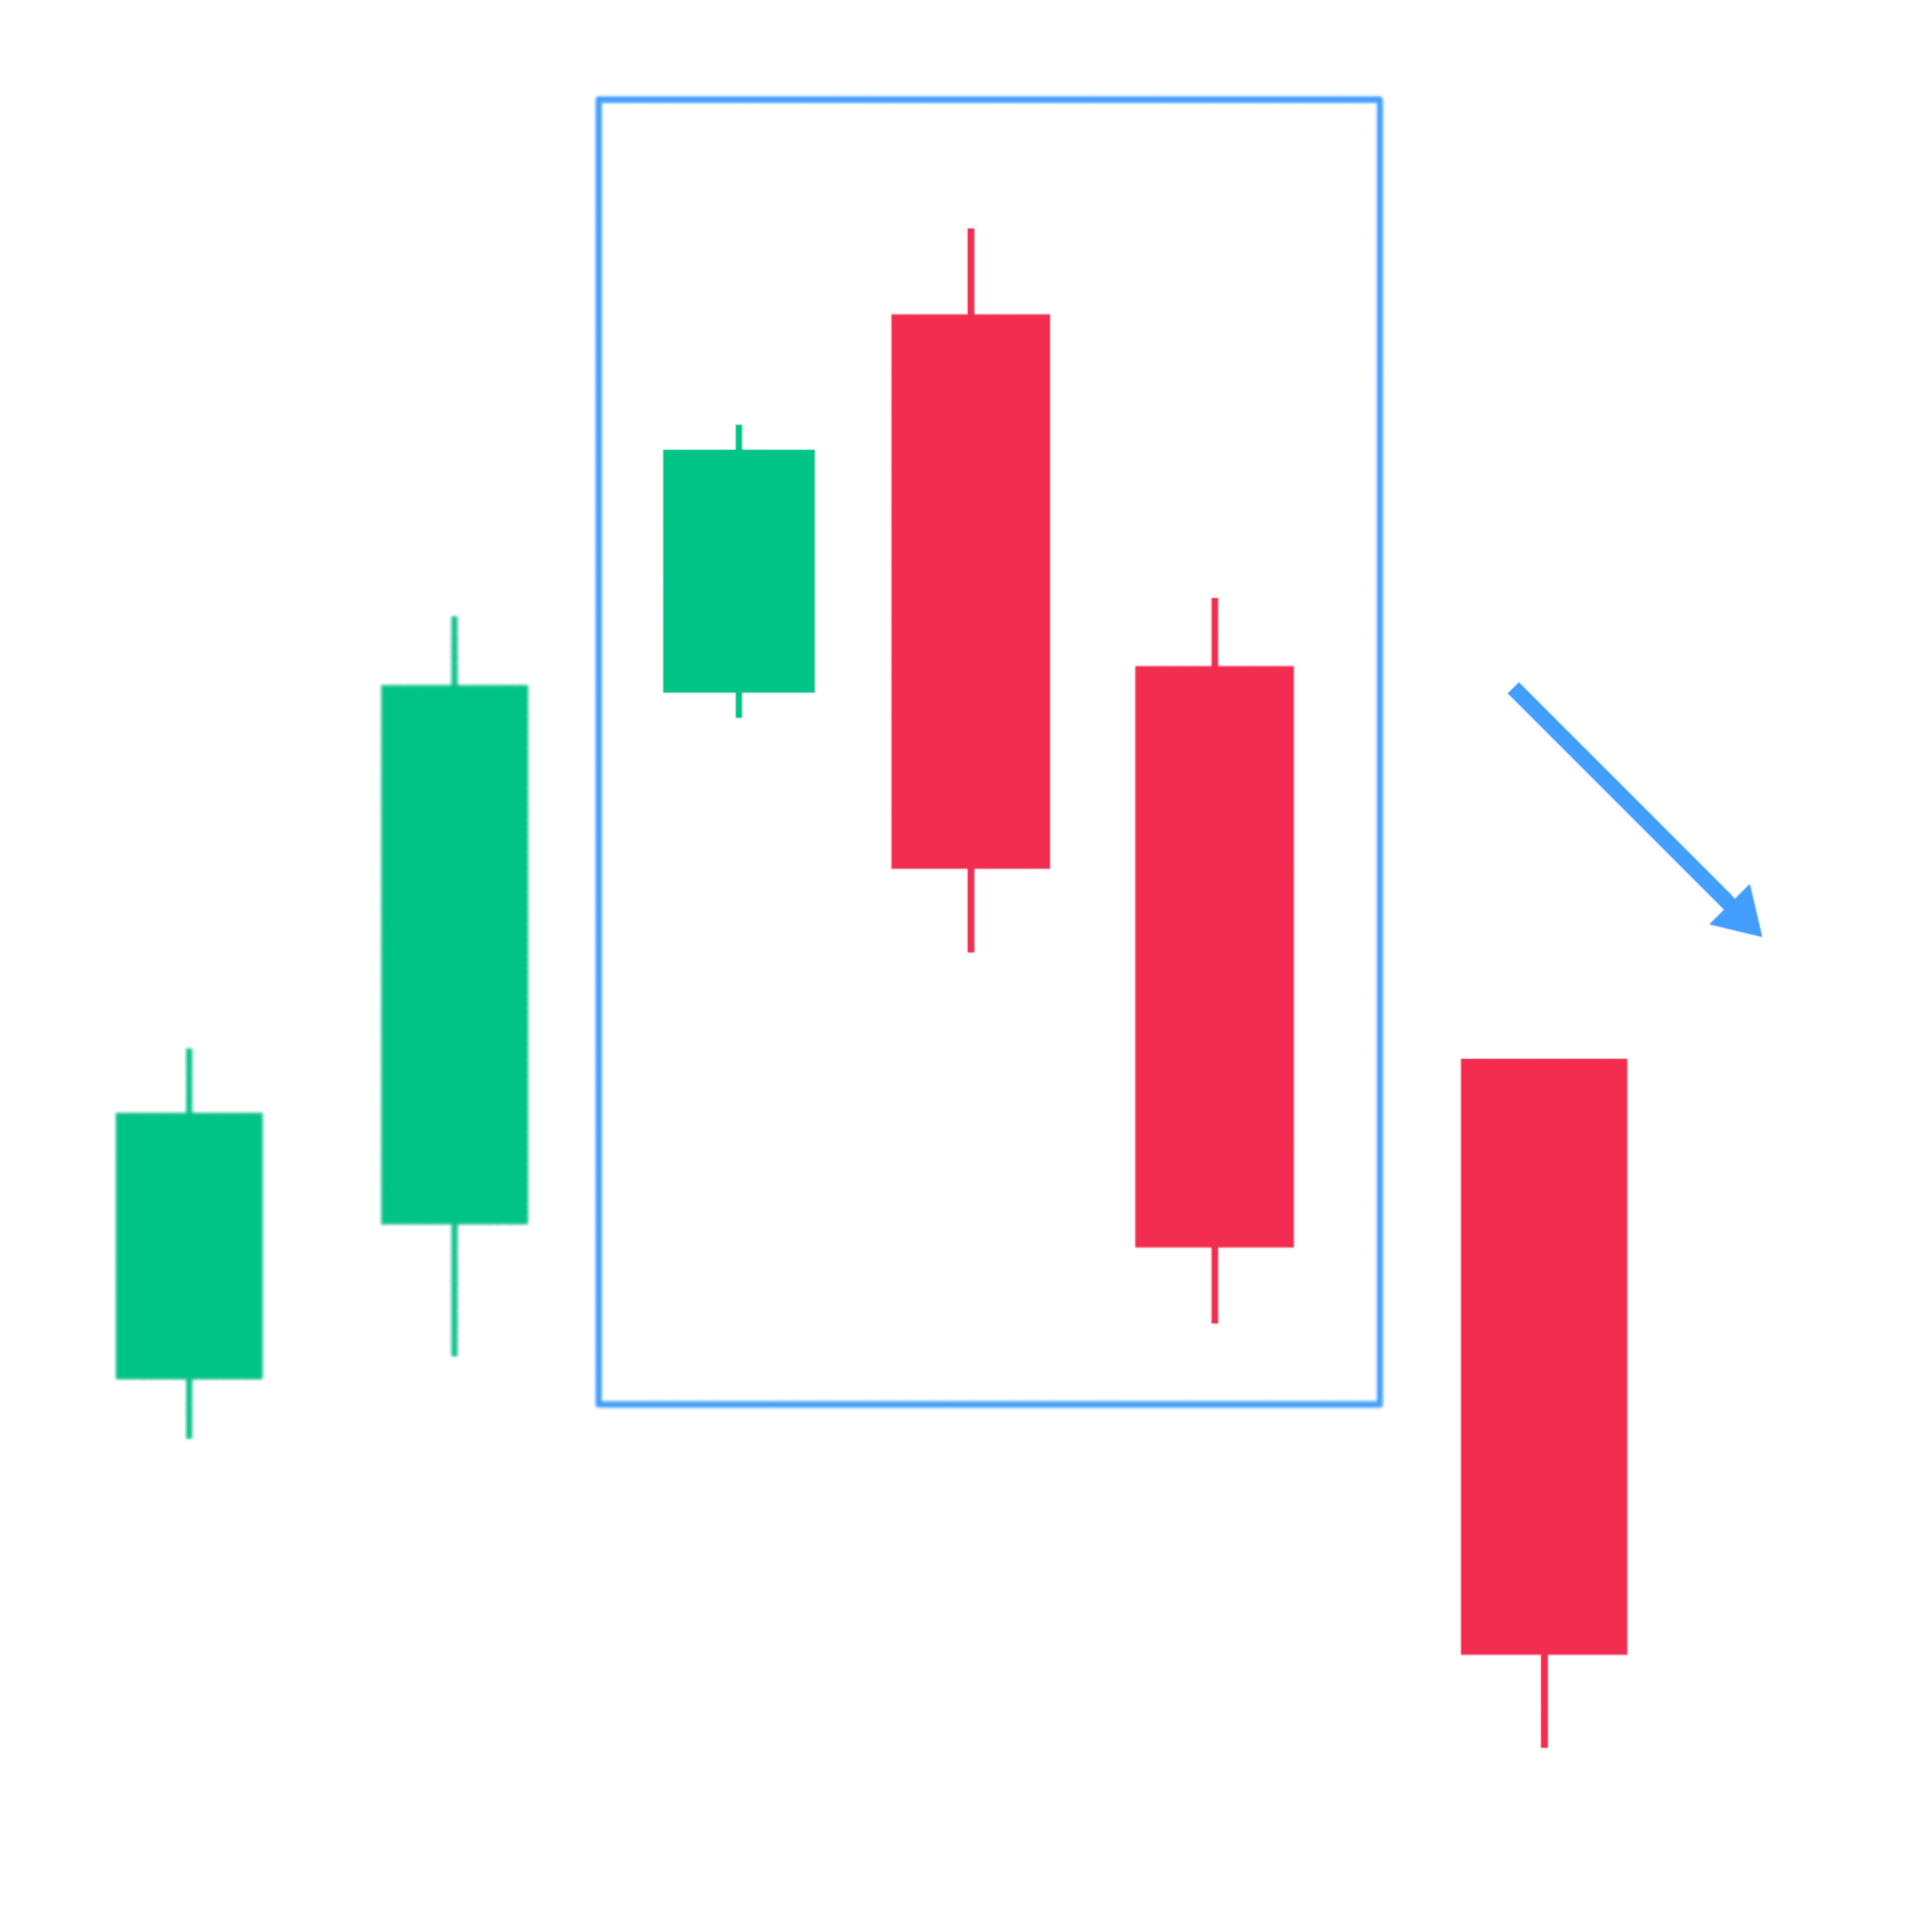
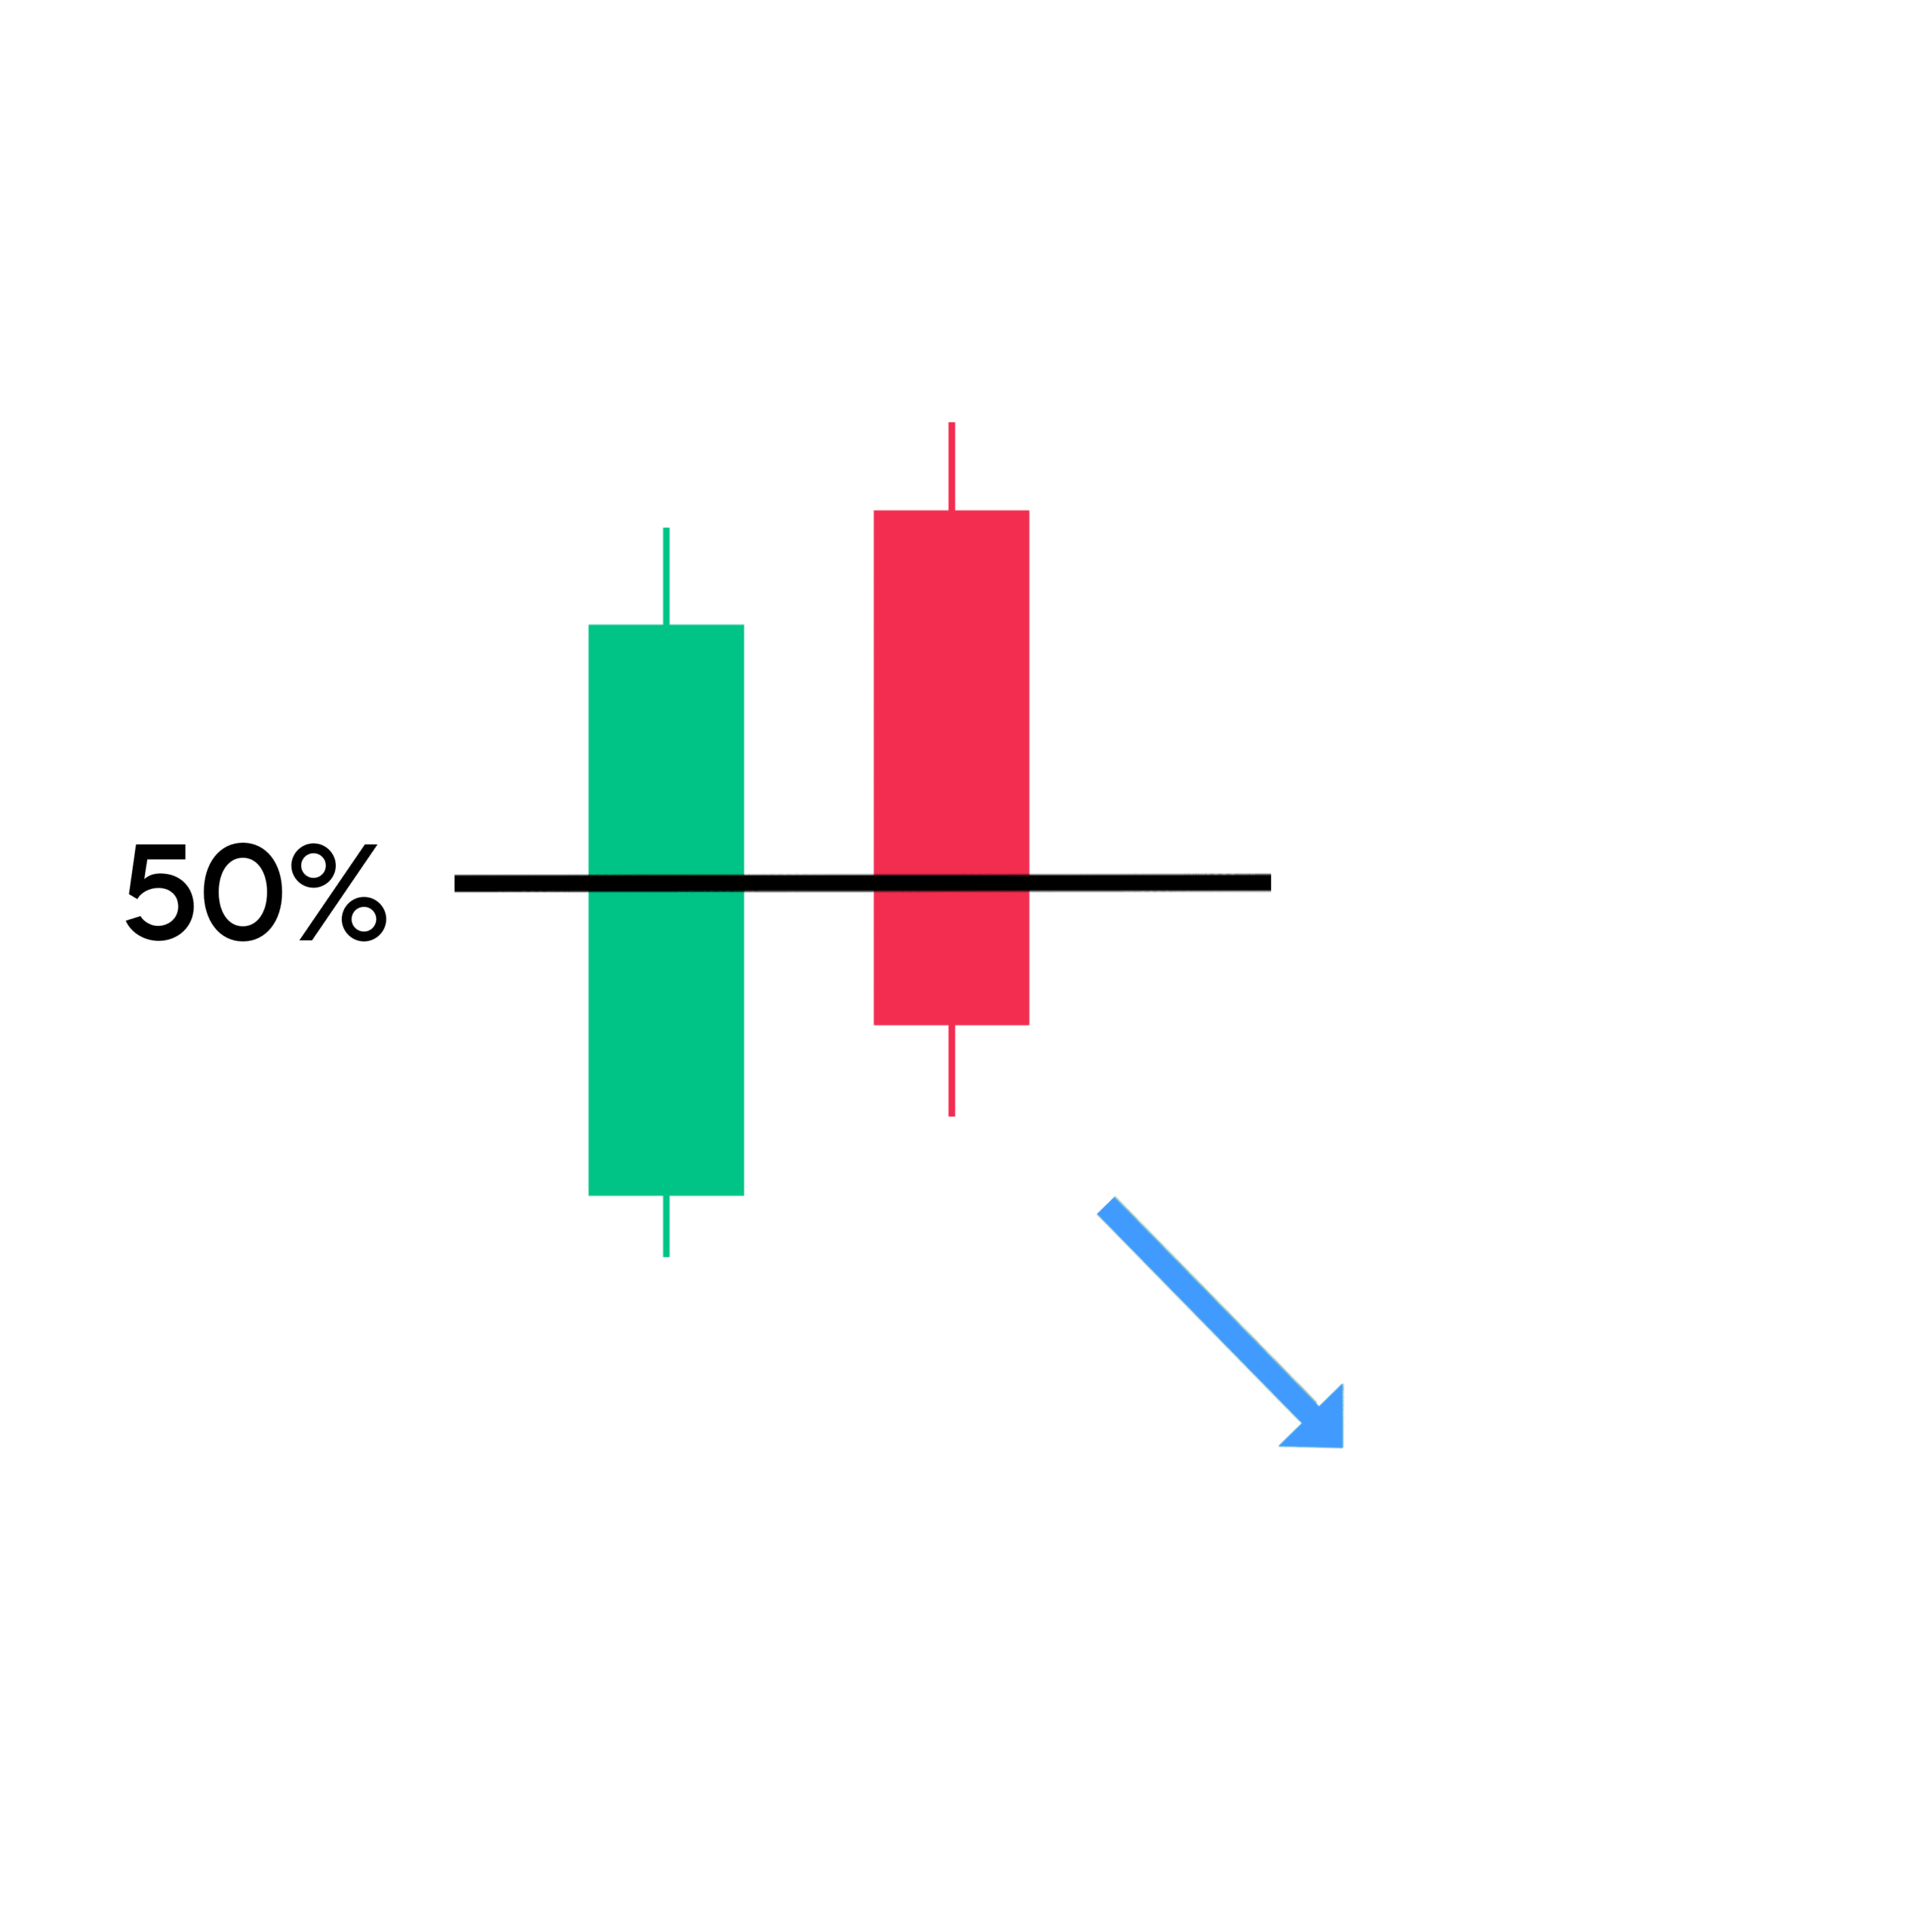
13. Dark Cloud

The dark cloud cover is a two-candle pattern that forms after the uptrend indicating a bearish reversal.
The first candle is a long bullish green candle, representing the continued uptrend. The second candle is a bearish red candle that opens above the high of the first candle (gap-up) but closes below the halfway of the first candle.
This pattern shows bulls are losing control after the gap-up, and the bears are taking over.
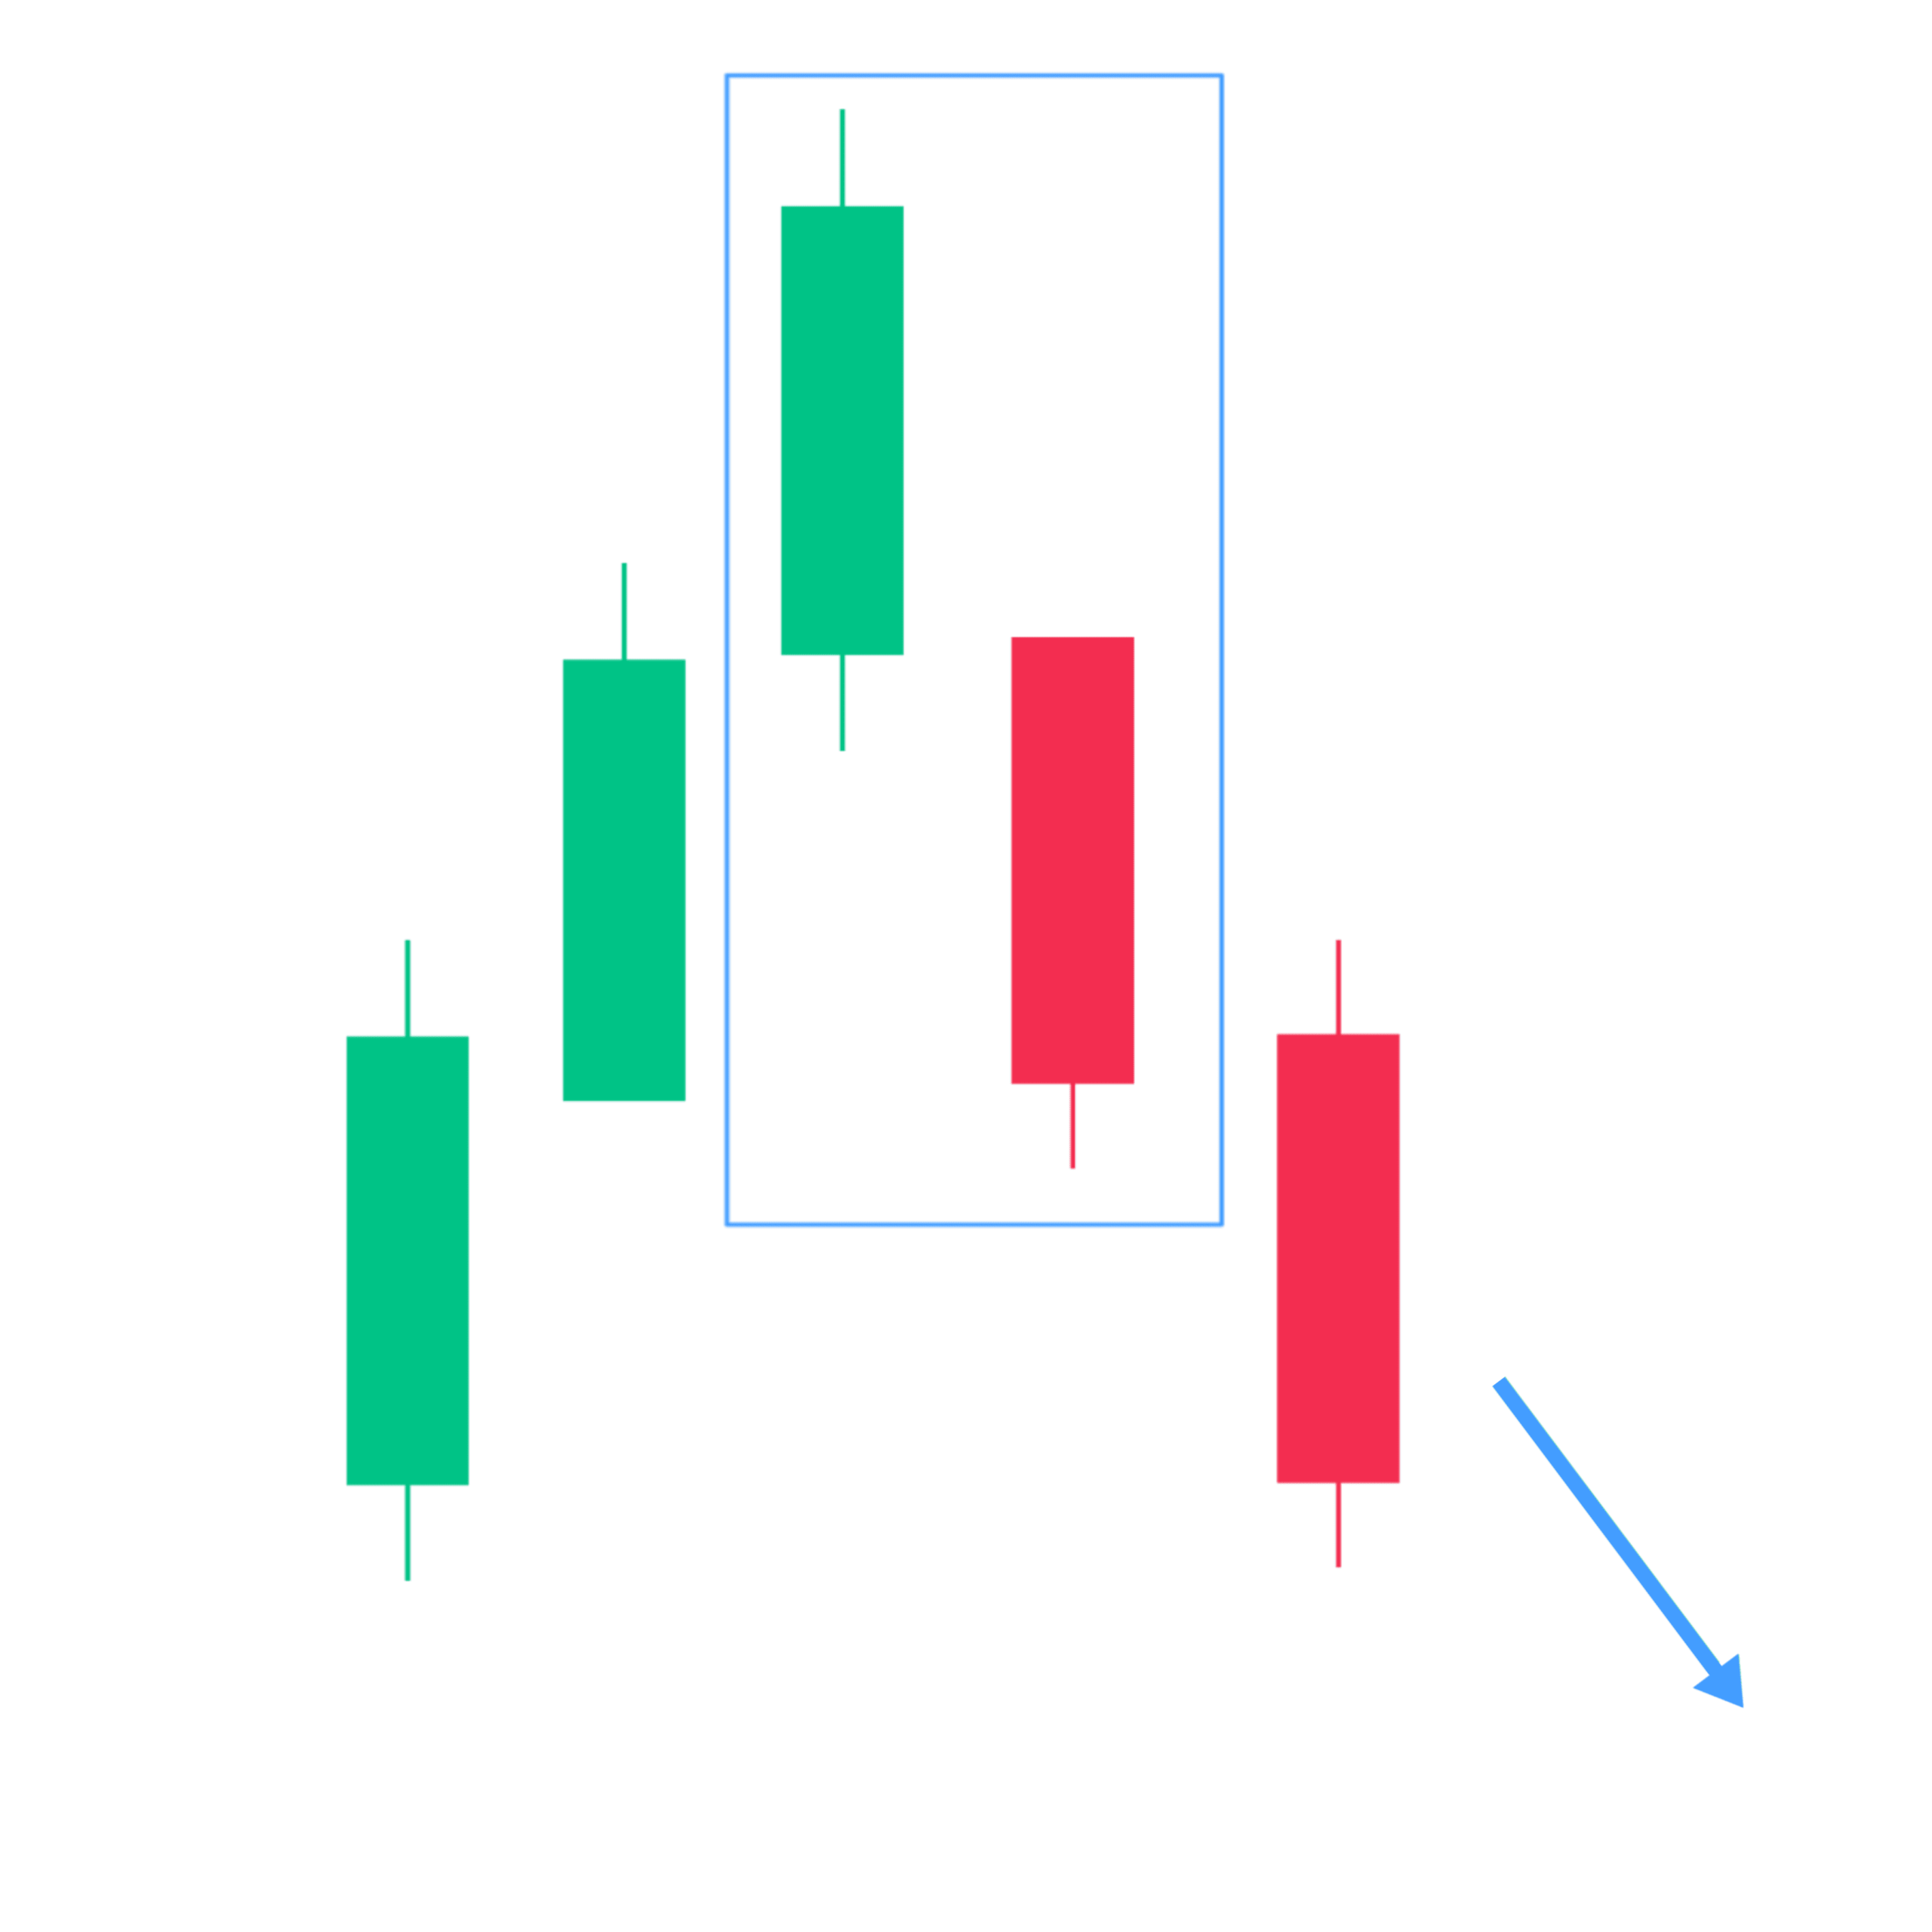
14. Bearish Kicker
The Bearish kicker is a two-candle pattern that signifies a strong and sudden reversal at the top of an uptrend.
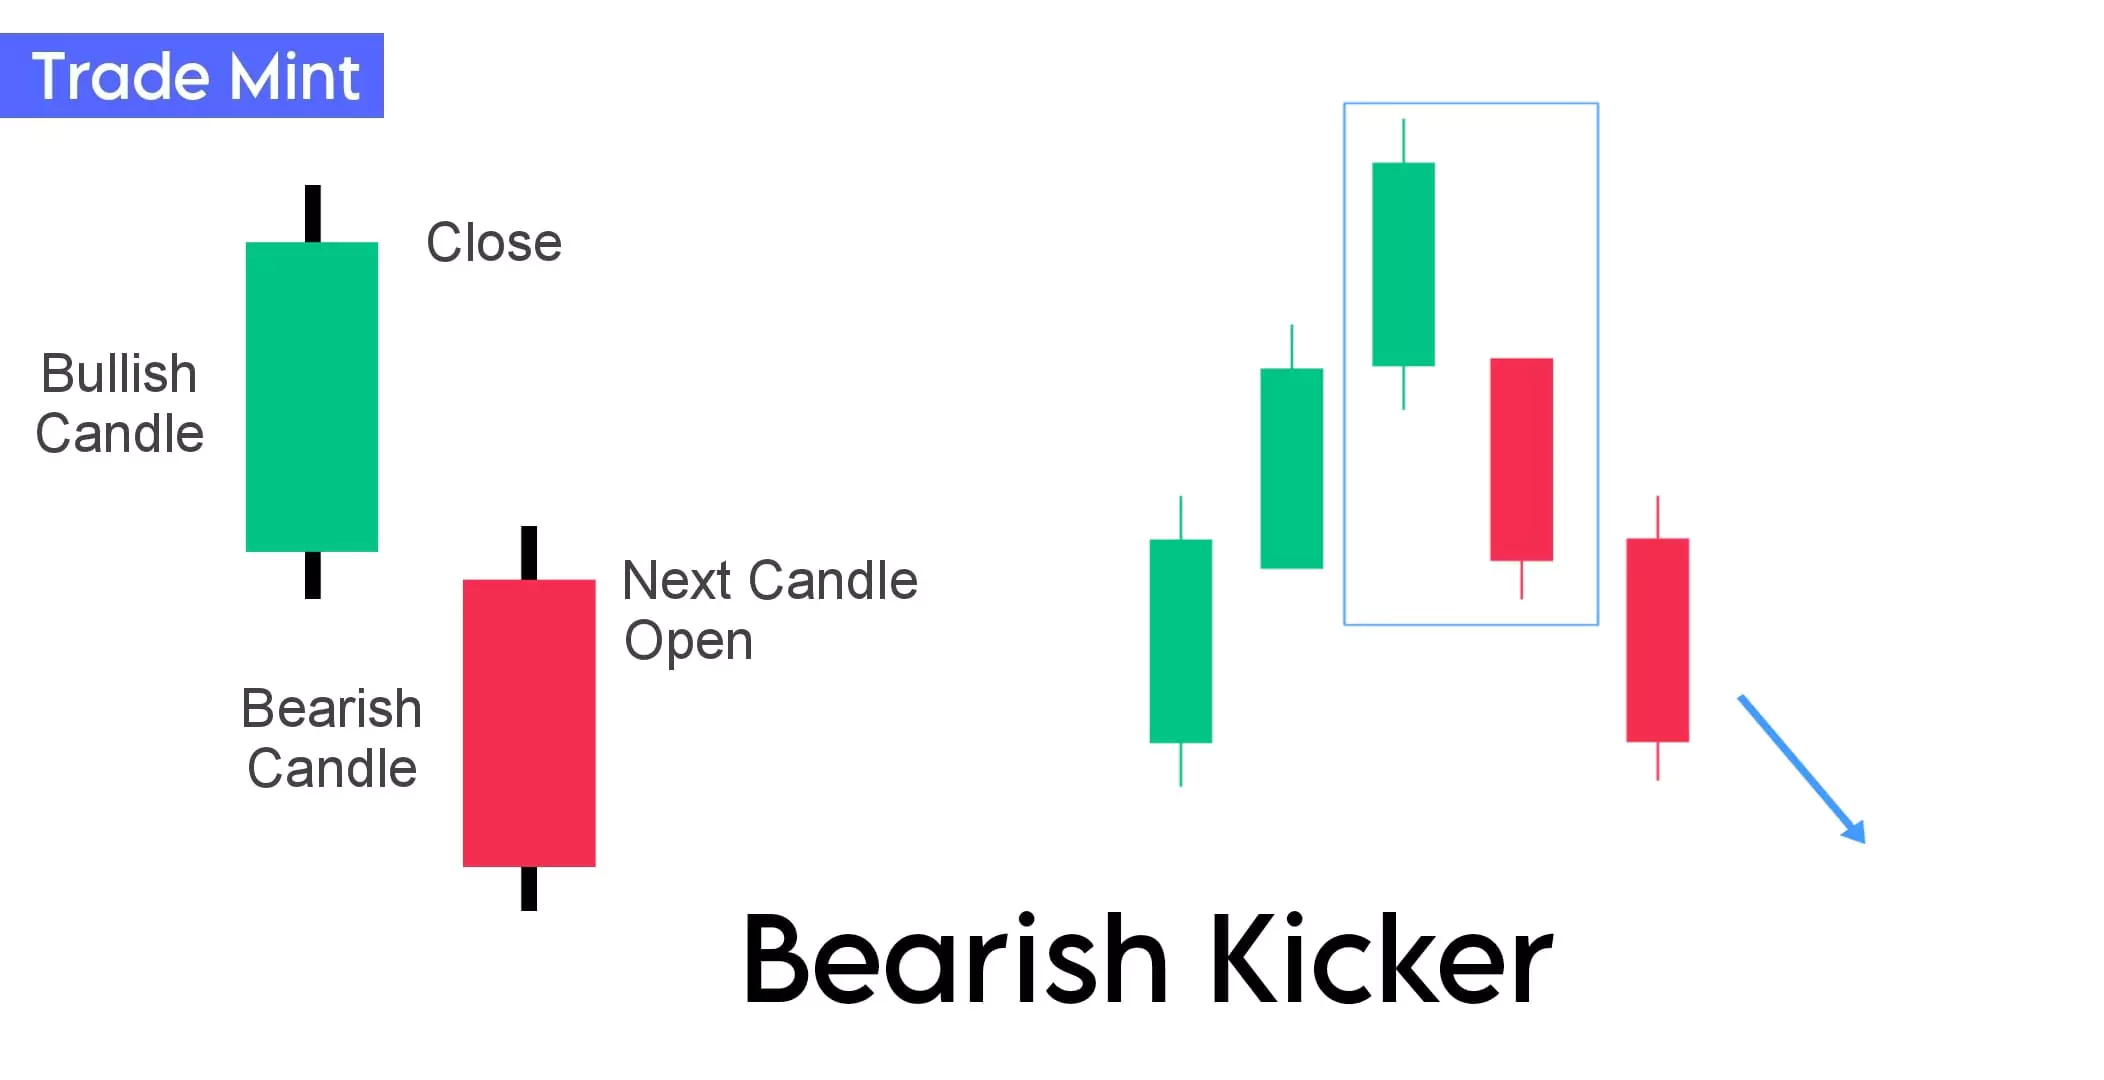
The key point of a Bearish kicker pattern is the unexpected gap down below the close of the previous candle indicating strong bearish momentum.
The second candle opens below the previous day’s low, showing a gap-down, and closes well below the previous day’s close. This sudden weakness indicates a potential trend reversal.
There’s a huge gap between the green candle’s closing price and the red candle’s open price and both candles are opposite to each other.
When considering entry and stop-loss for the Bearish kicker pattern, traders may enter a short position when the third candle breaks the low of the second candle, and set a stop-loss at the high of the first candle.
15. Spinning Top
Refer the section #15-spinning-top-bottom
Continuation Candlestick Patterns
When the price of a market asset pauses, consolidates, and then continues moving in the same direction as the prevailing trend known as a continuation patterns.
Below are the various types of continuation candlestick patterns:
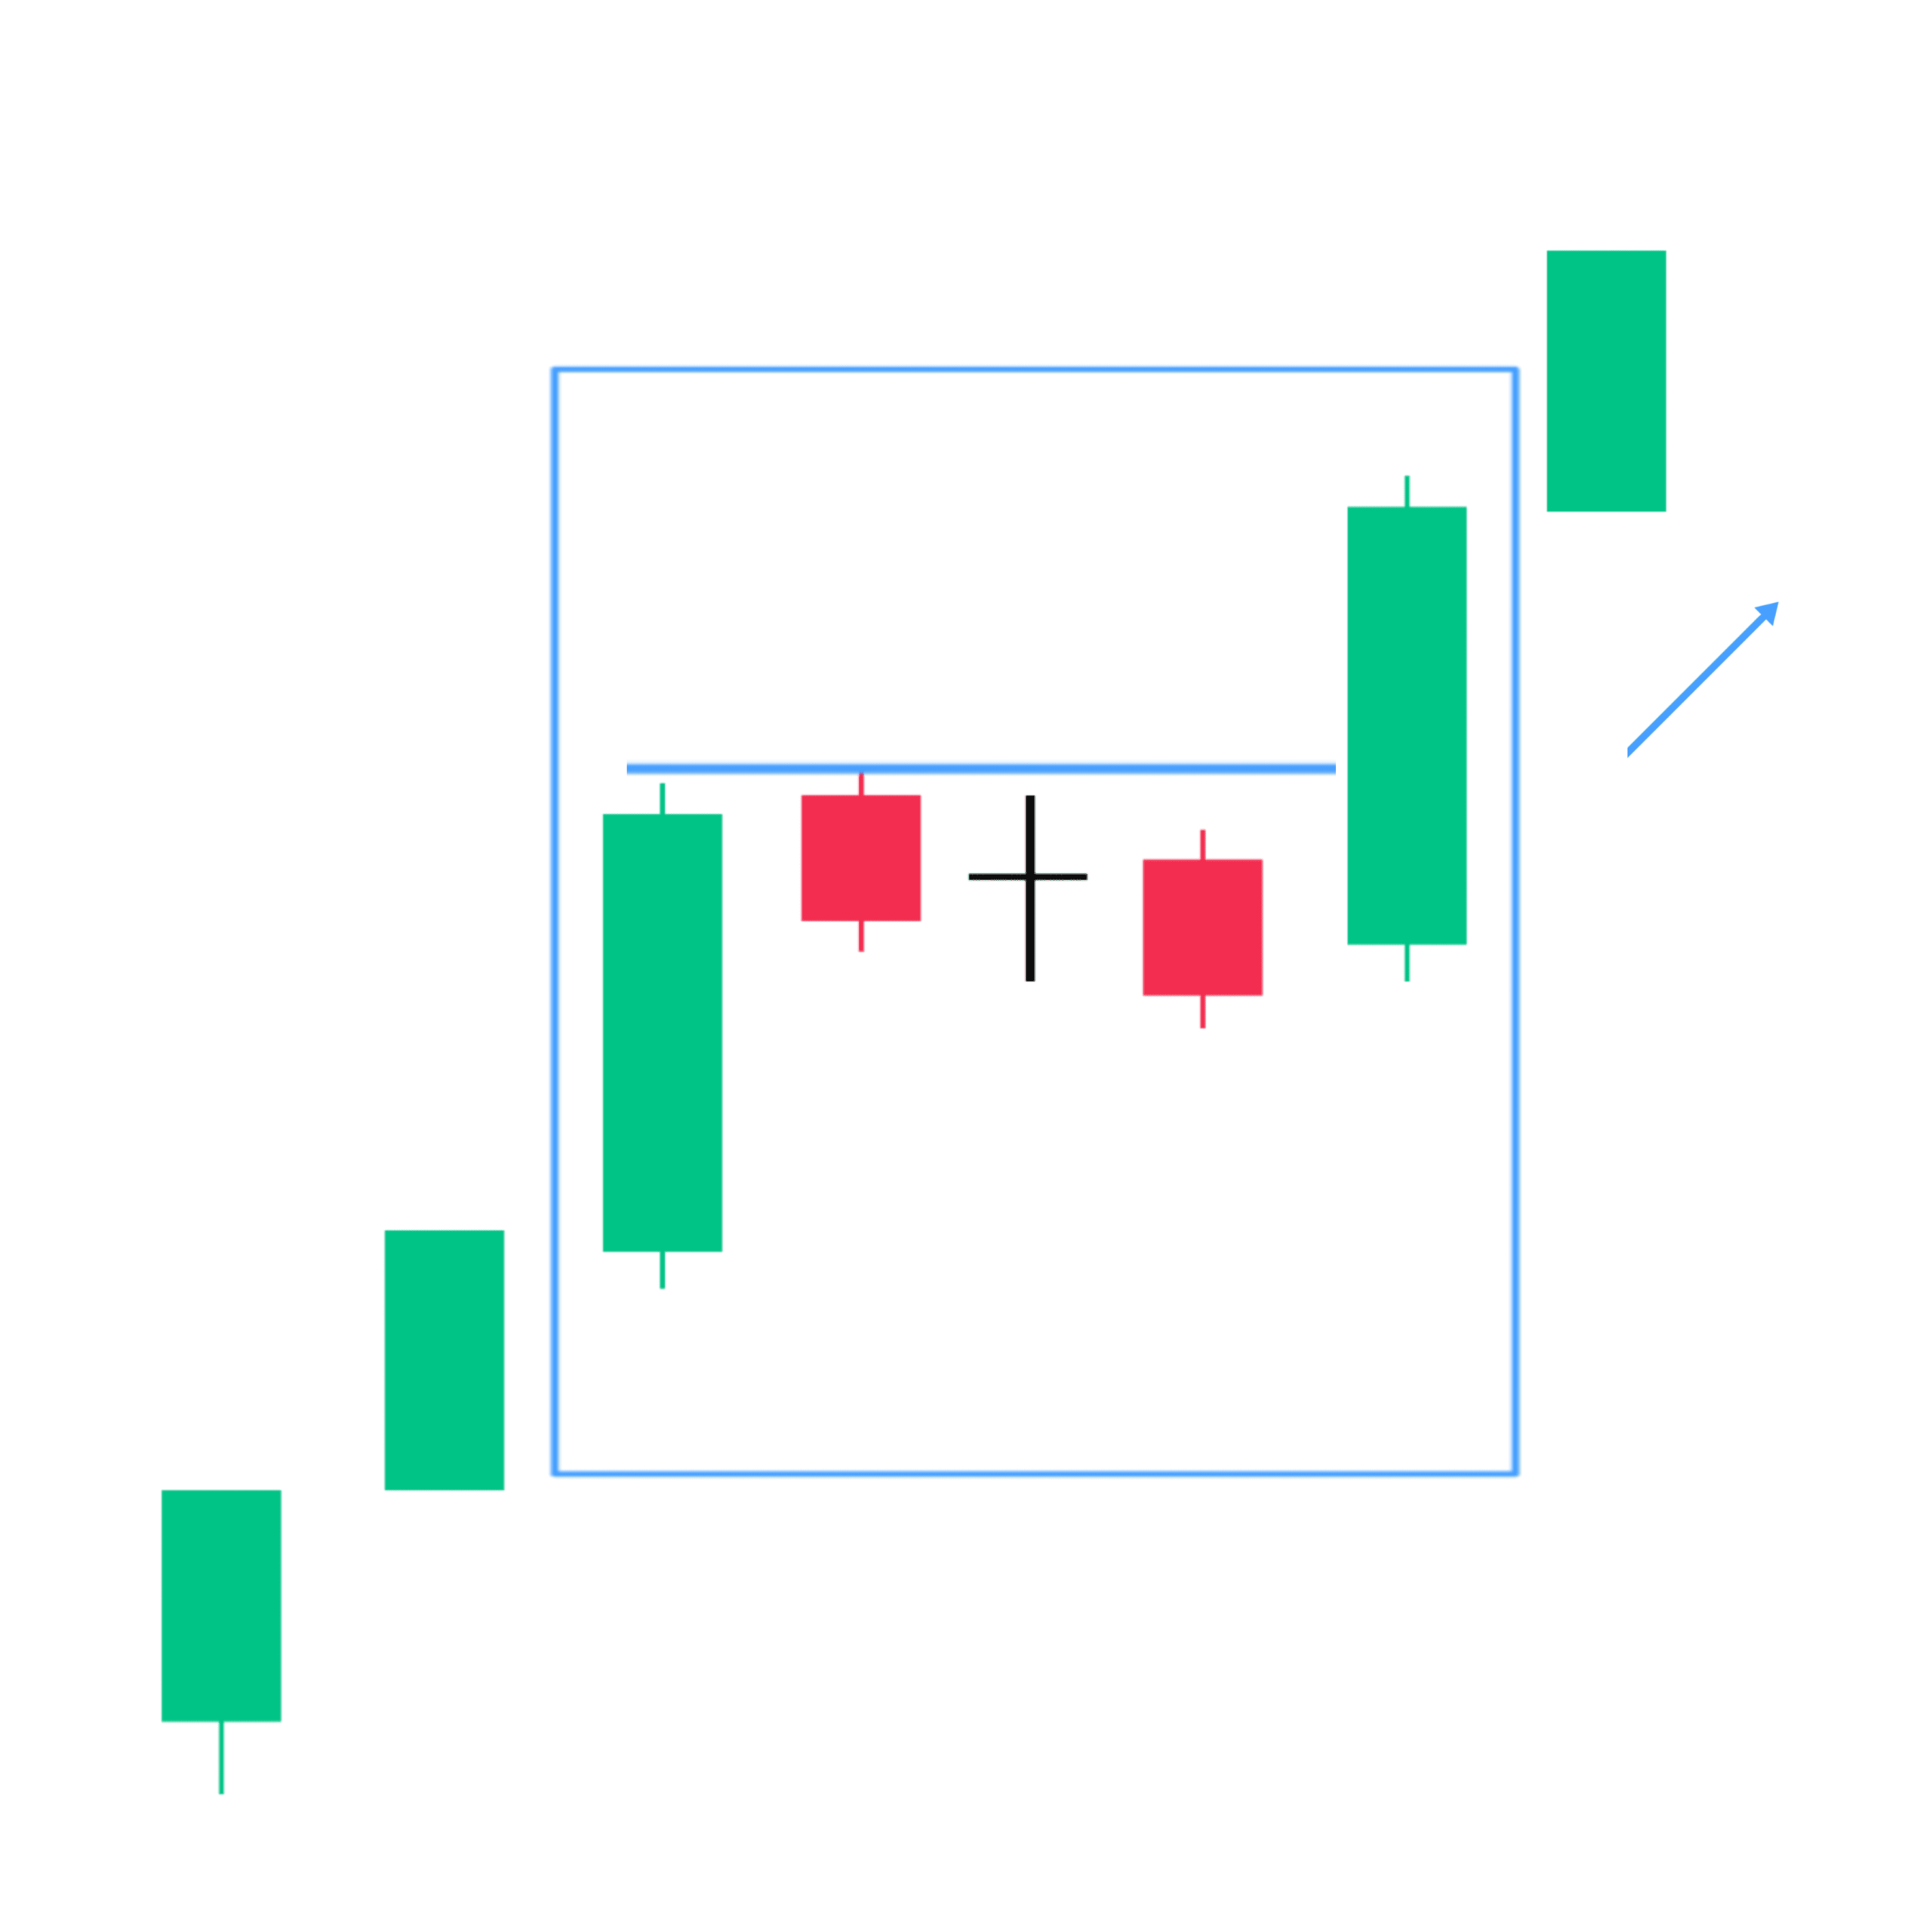
1. Rising Three Method
The Rising Three Method is a bullish continuation candlestick pattern that consists of a series of five candles. It appears during an existing uptrend and signals that the bullish momentum continued.
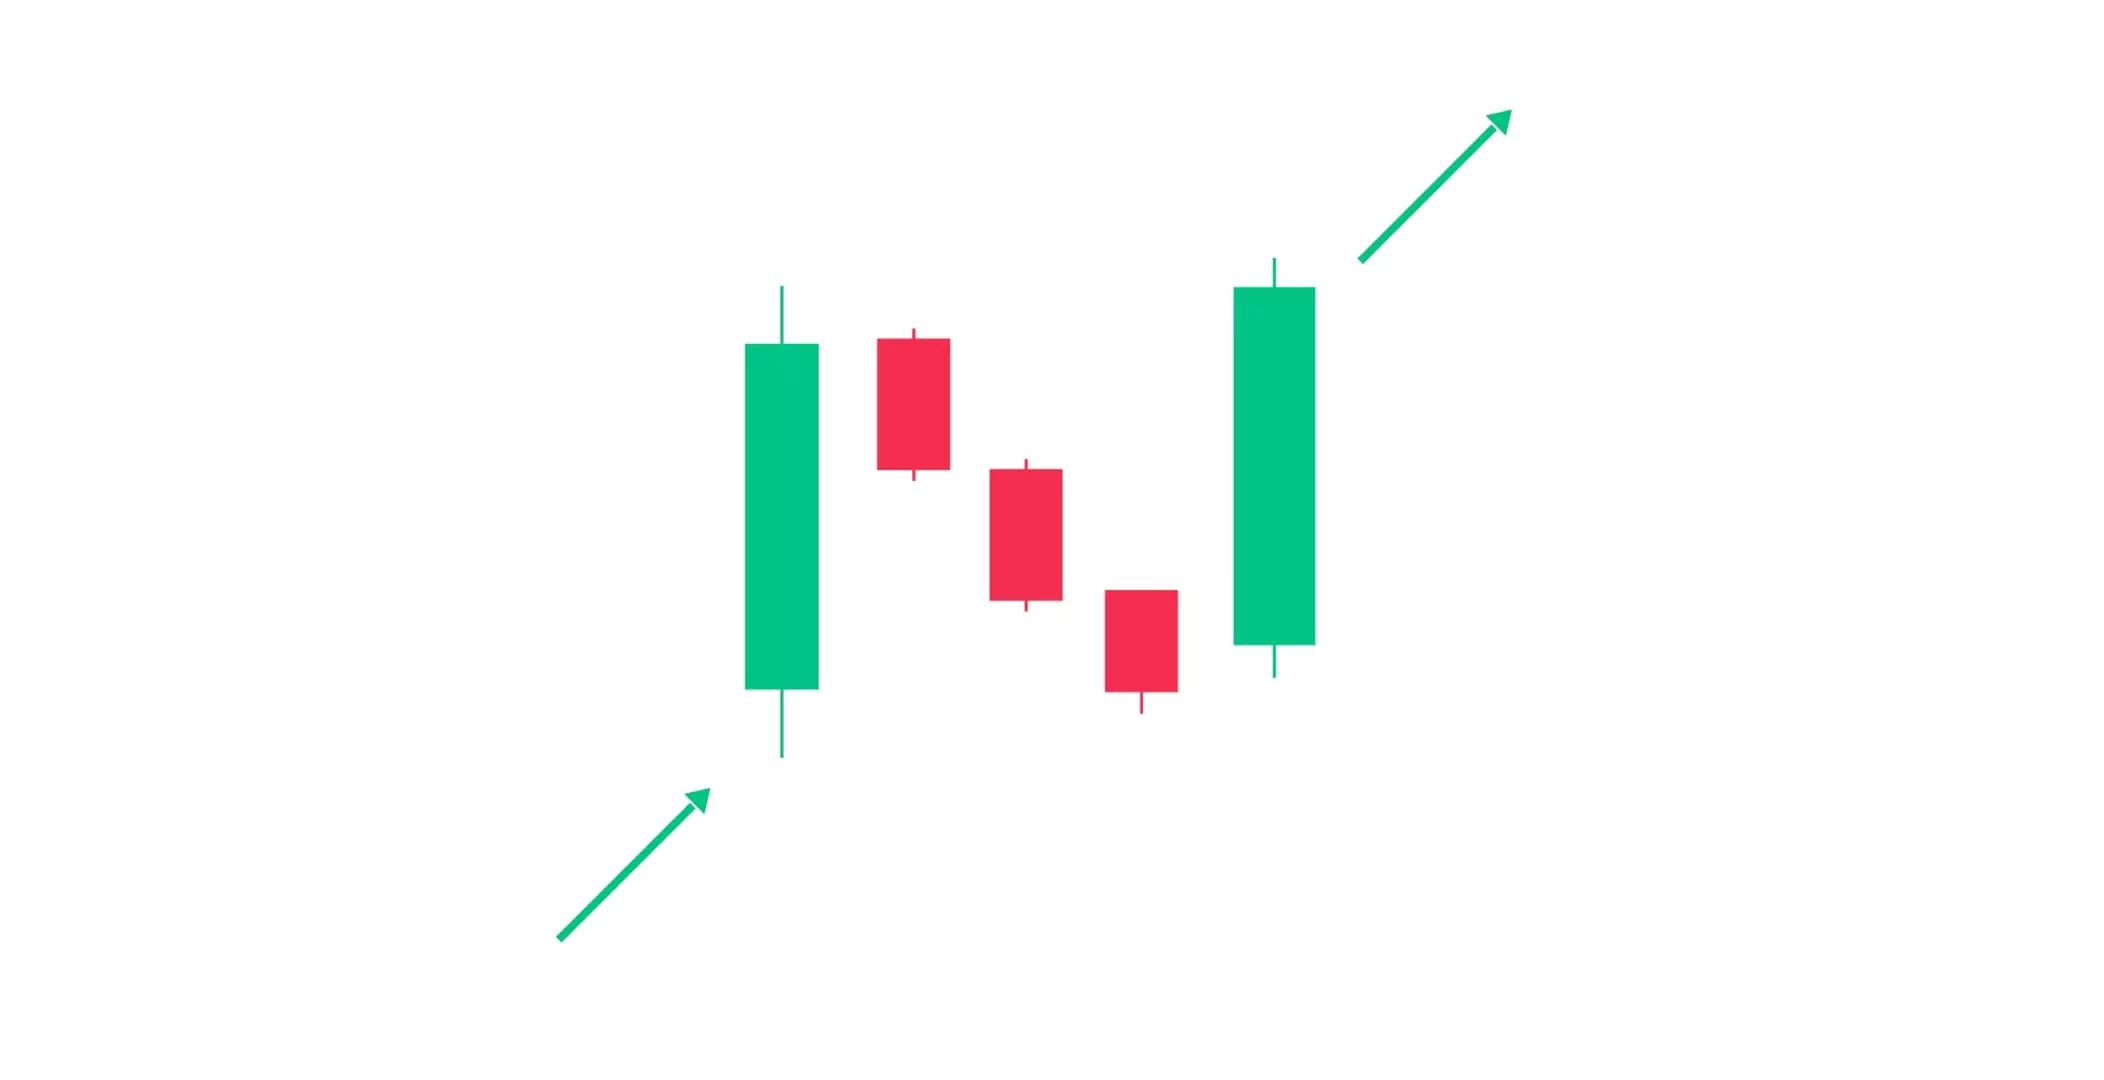
The first candle of the pattern begins with a long bullish candle, representing the uptrend.
The second, Third, and Fourth Candles an initially bearish candles, these three candles are smaller and typically bearish and contained within the high and low range of the first candle.
The fifth and final candle closes above the highs of the three small candles, indicating a continuation of the bullish trend.
The Rising Three Method suggests a temporary consolidation or pause in the upward movement and smaller bearish candles in the trend represent a minor profit-taking.
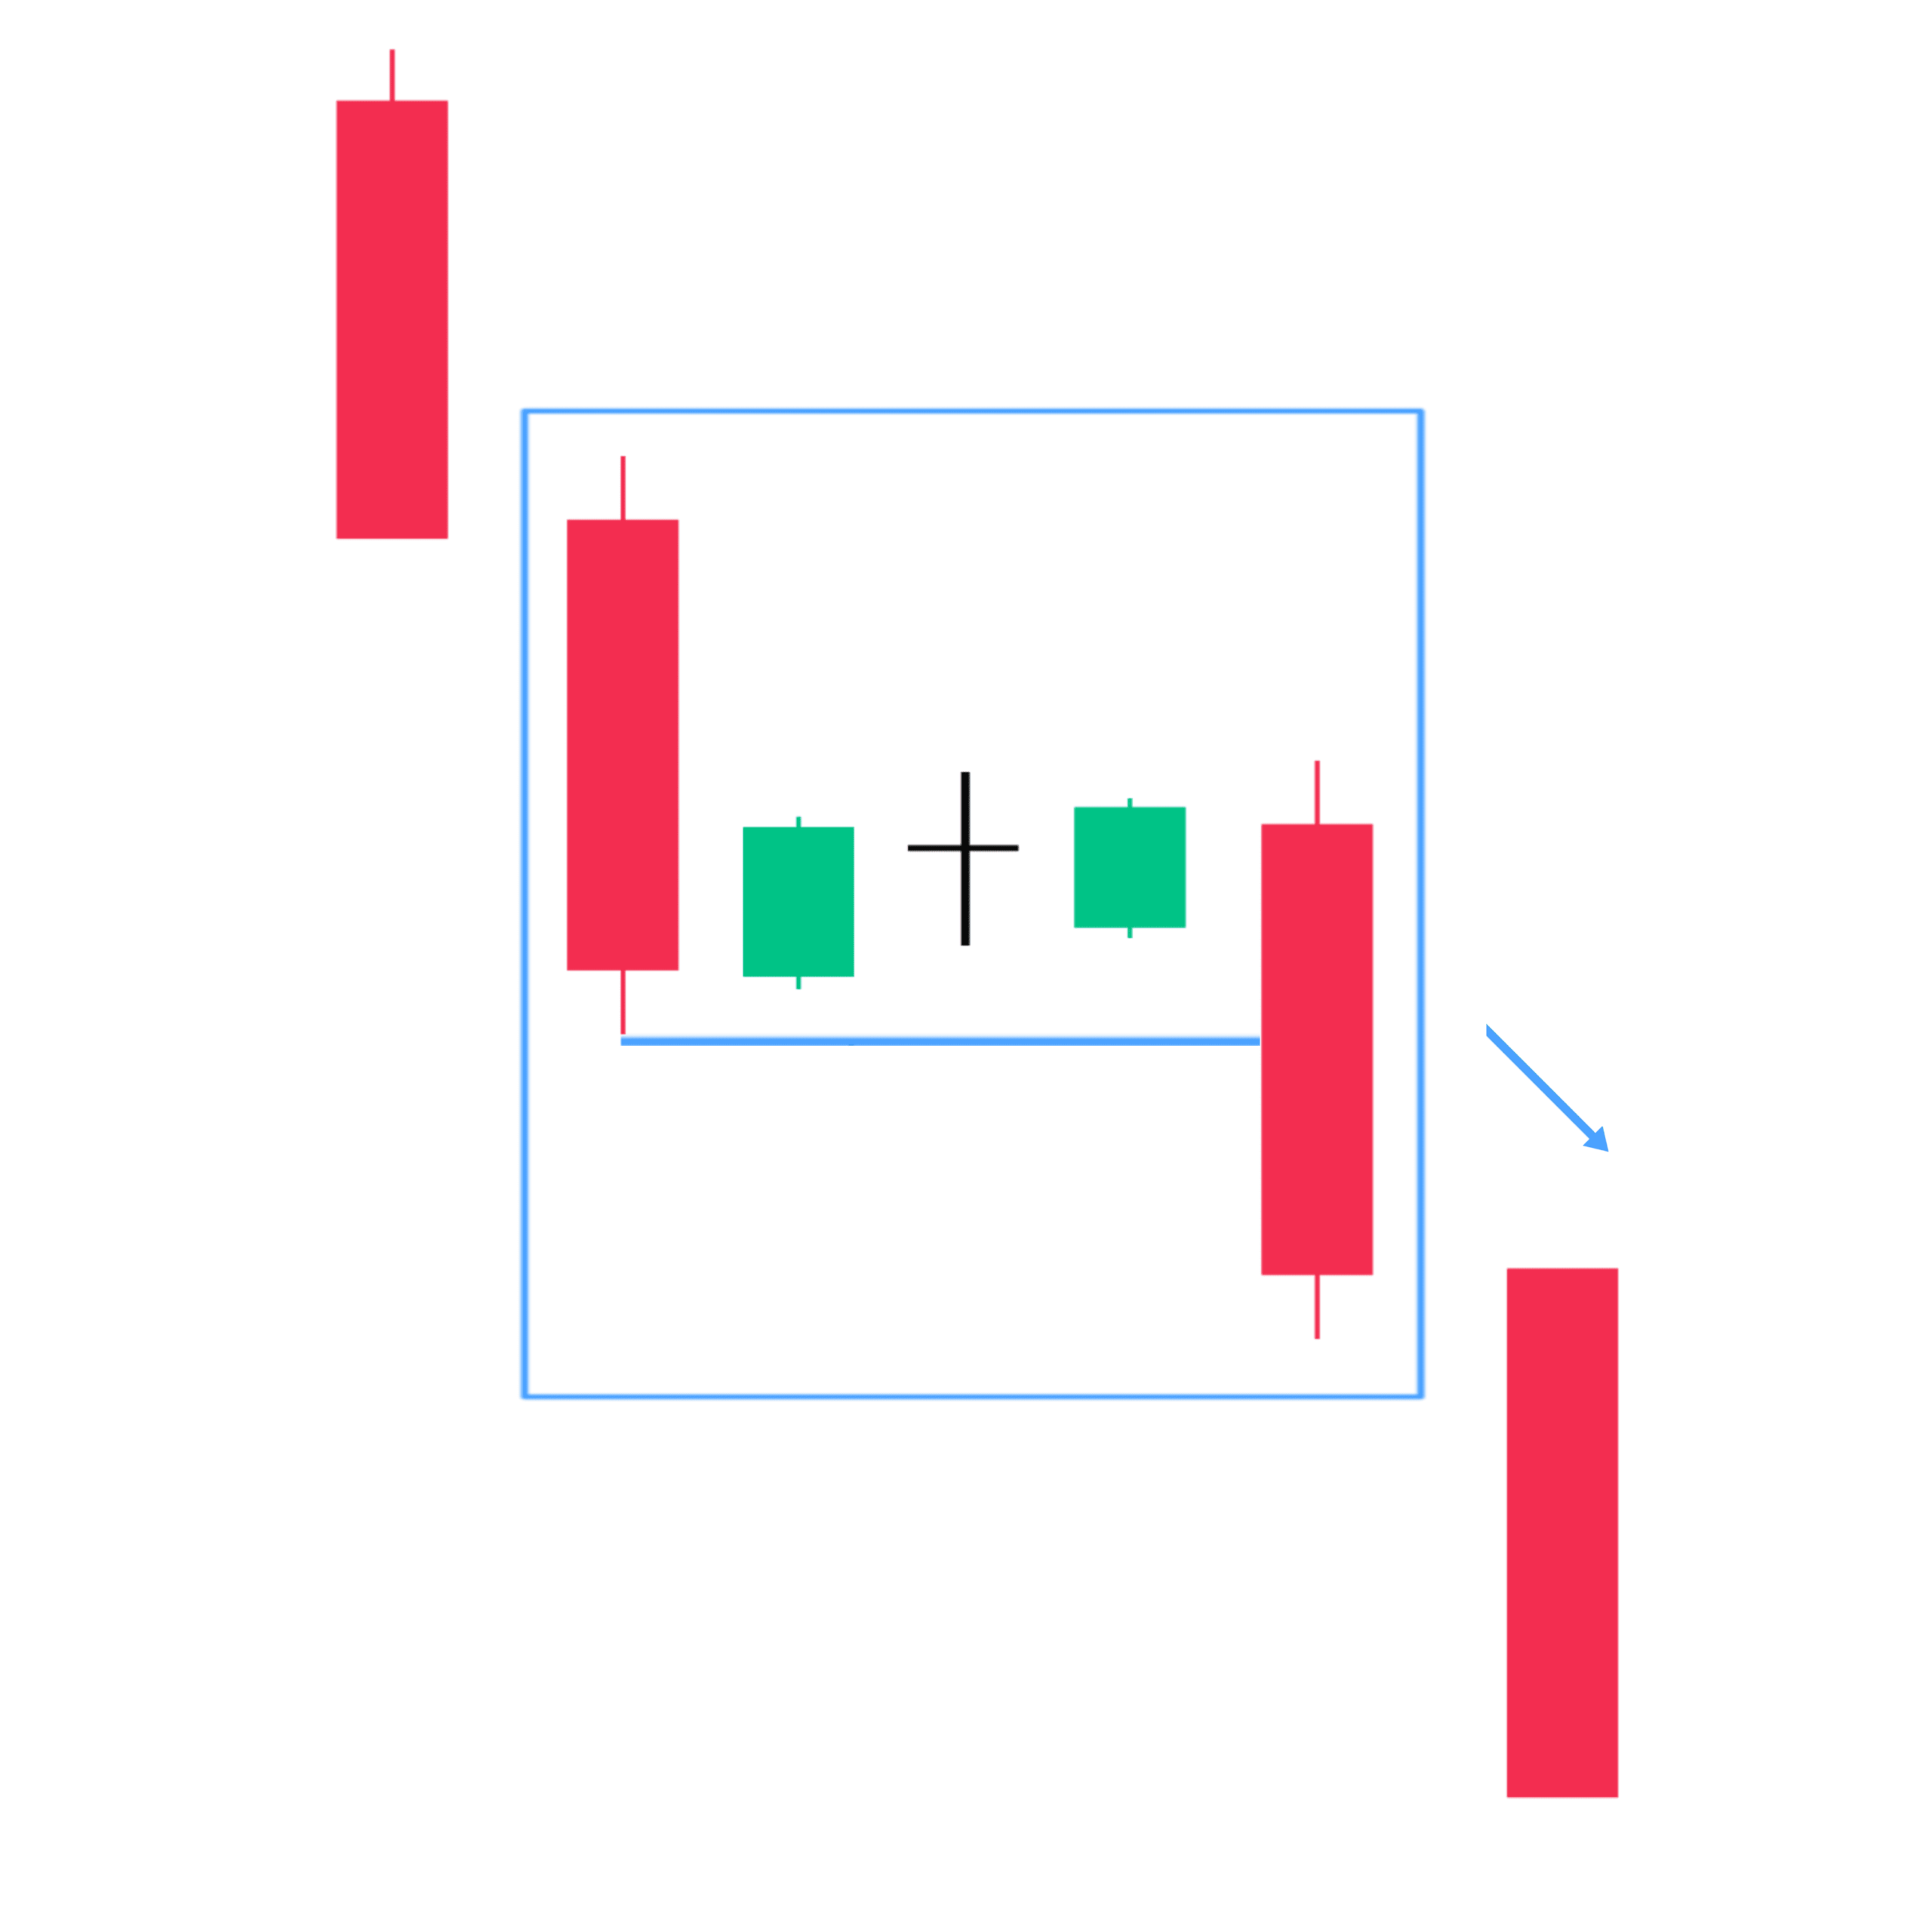
2. Falling Three Method
The Falling Three Method is a bearish continuation candlestick pattern consisting of five candles. This pattern typically occurs in a downtrend and signals the bearish momentum continued.
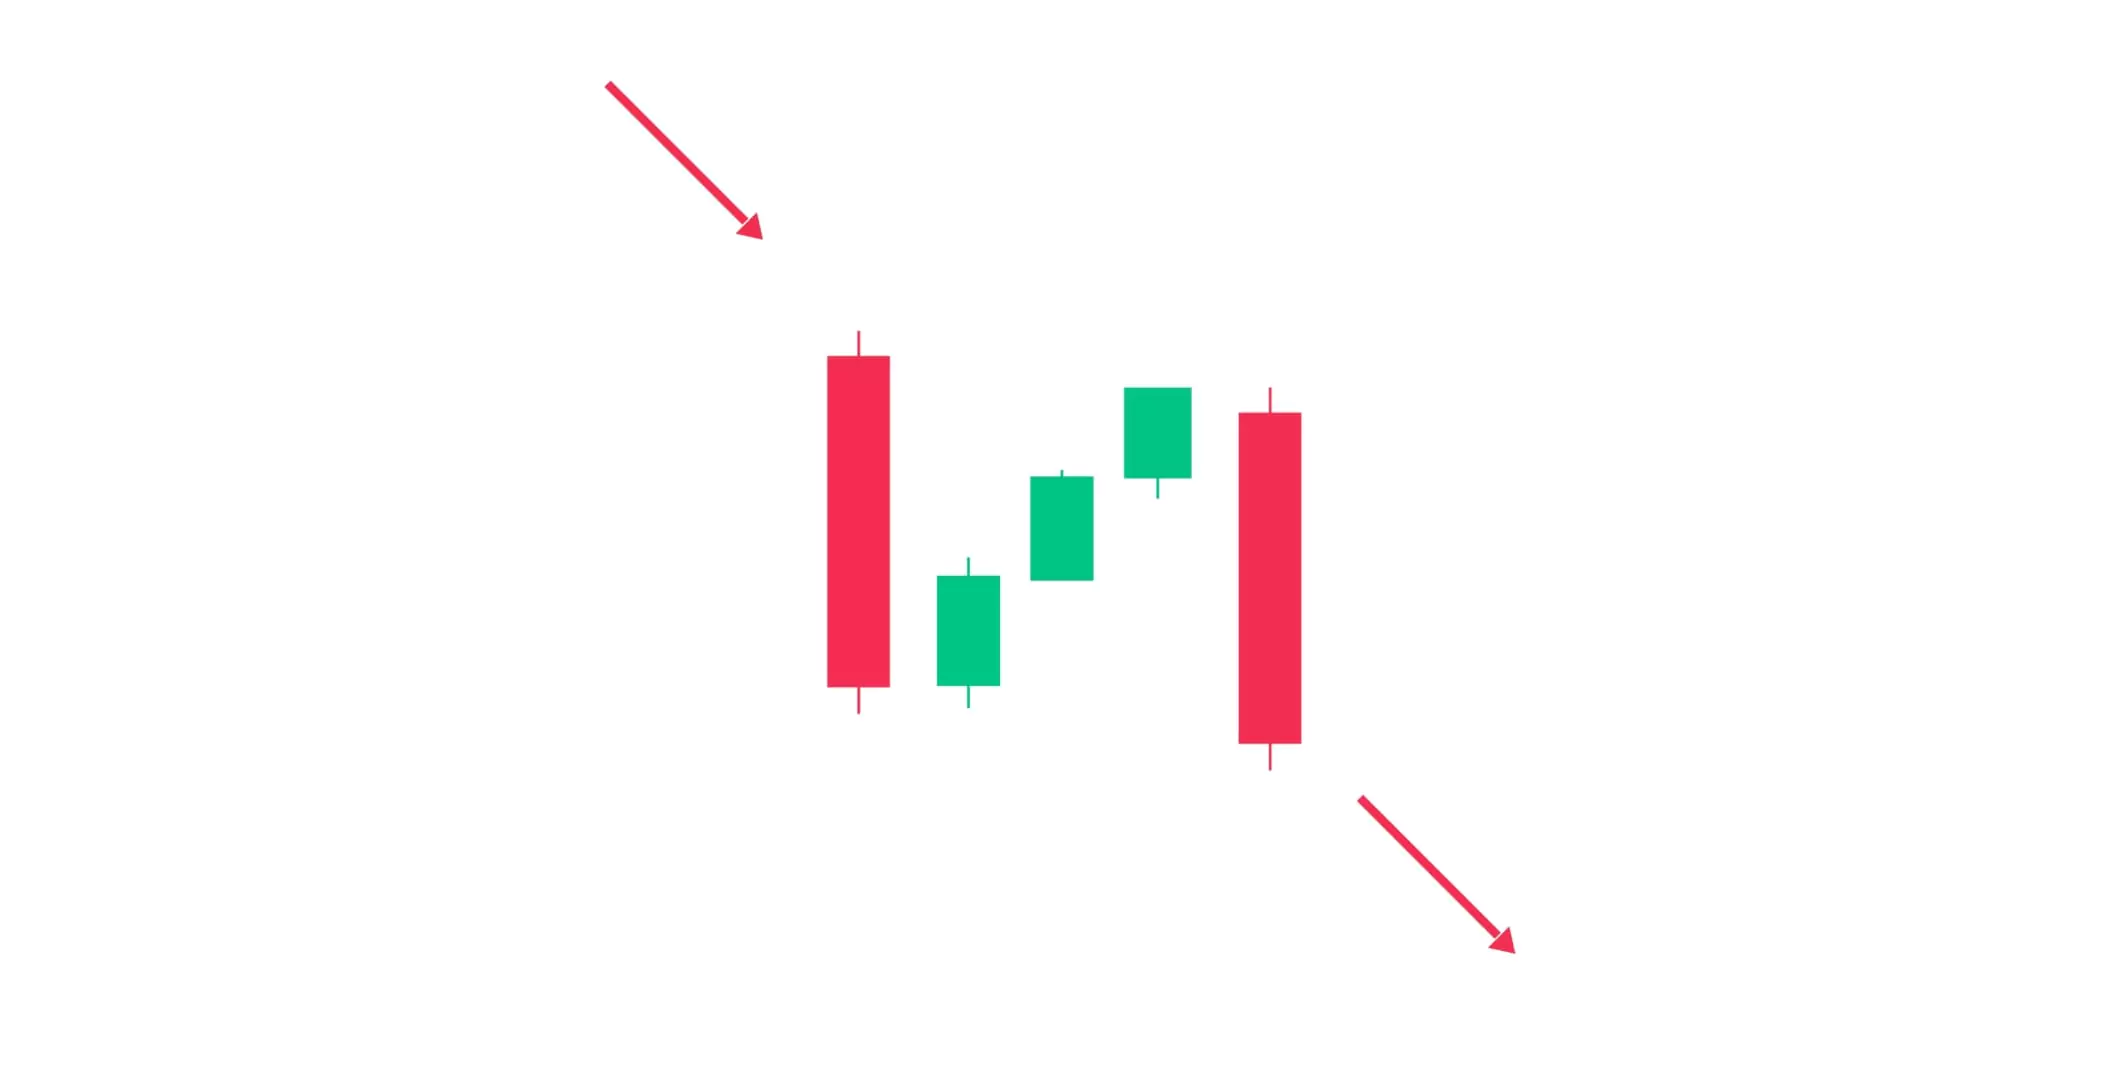
The first candle of the pattern begins with a long bearish candle, representing the uptrend.
The second, Third, and Fourth Candles an initially bullish candles, these three candles are smaller and typically bearish contained within the high and low range of the first candle.
The fifth and final candle another long bearish candle closes below the low of the three small candles including the first candle, indicating a continuation of the bullish trend.
The Falling Three Method suggests a temporary consolidation or pause in the downward movement and smaller bullish candles represent a minor profit-taking.
3 & 4. Upside & Downside Tasuki Gap
The Upside Tasuki Gap and Downside Tasuki Gap are continuation candlestick patterns that involve a gap between two consecutive candlesticks. This pattern occurs in an uptrend as well as a downtrend and signals the continuation of movement.
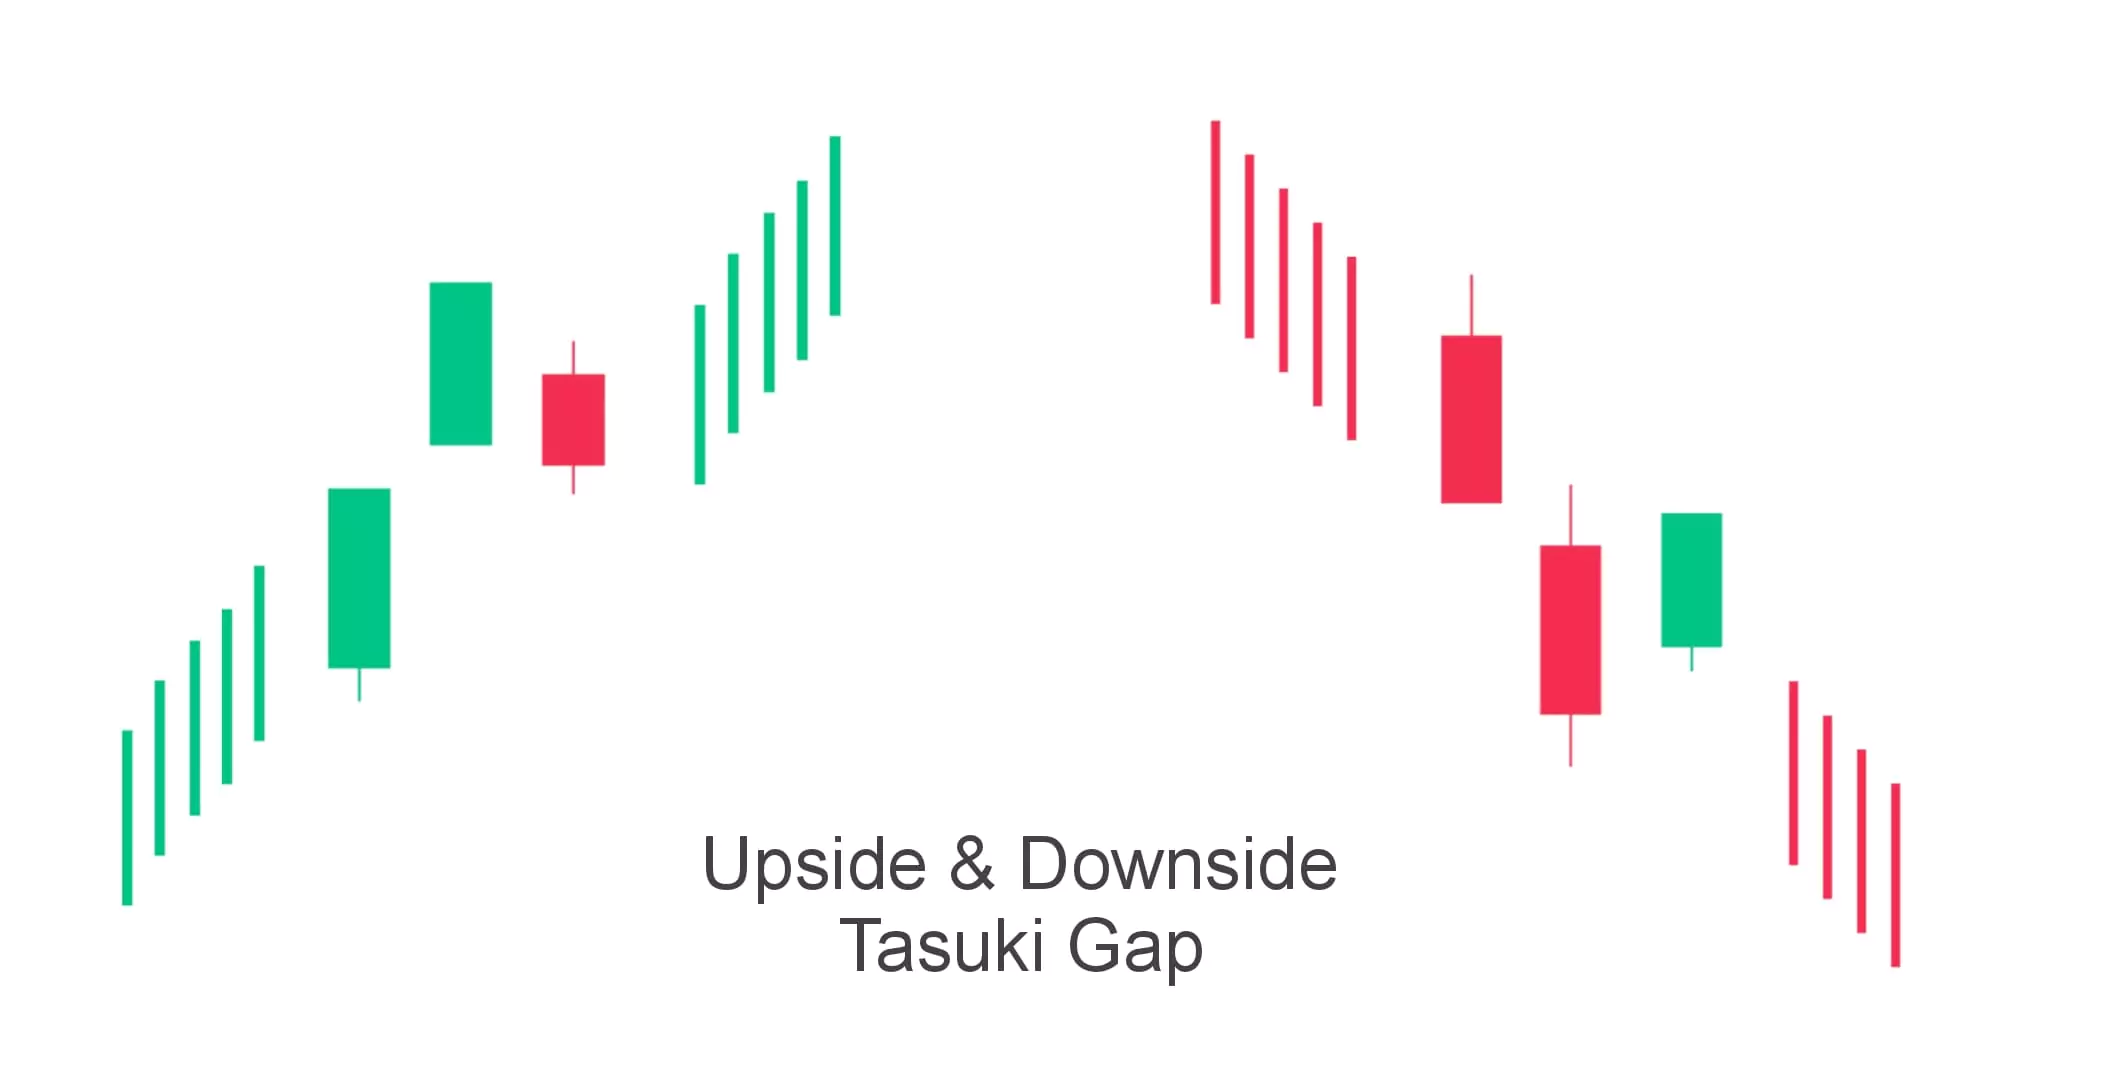
The Upside Tasuki Gap is a bullish continuation pattern. It occurs in an existing uptrend, The first candle in this pattern is a bullish green candle. The second candle opens with a gap up from the first candle and is also a bullish candle. The third candle is a bearish red candle that opens within the body of the second candle and tests the low of the second candle.
The Upside Tasuki Gap suggests a temporary consolidation or pullback in an uptrend.
The Downside Tasuki Gap is a bearish continuation pattern. It occurs in an existing downtrend, The first candle in this pattern is a bearish red candle. The second candle opens with a gap down from the first candle and is also a bearish candle. The third candle is a bullish green candle that opens within the body of the second candle and tests the high of the second candle.
The Downside Tasuki Gap suggests a temporary consolidation or pullback in a downtrend.
The Tasuki Gap patterns provide insights into short-term pauses or profit booking within existing trends and the potential continuation of the market direction.
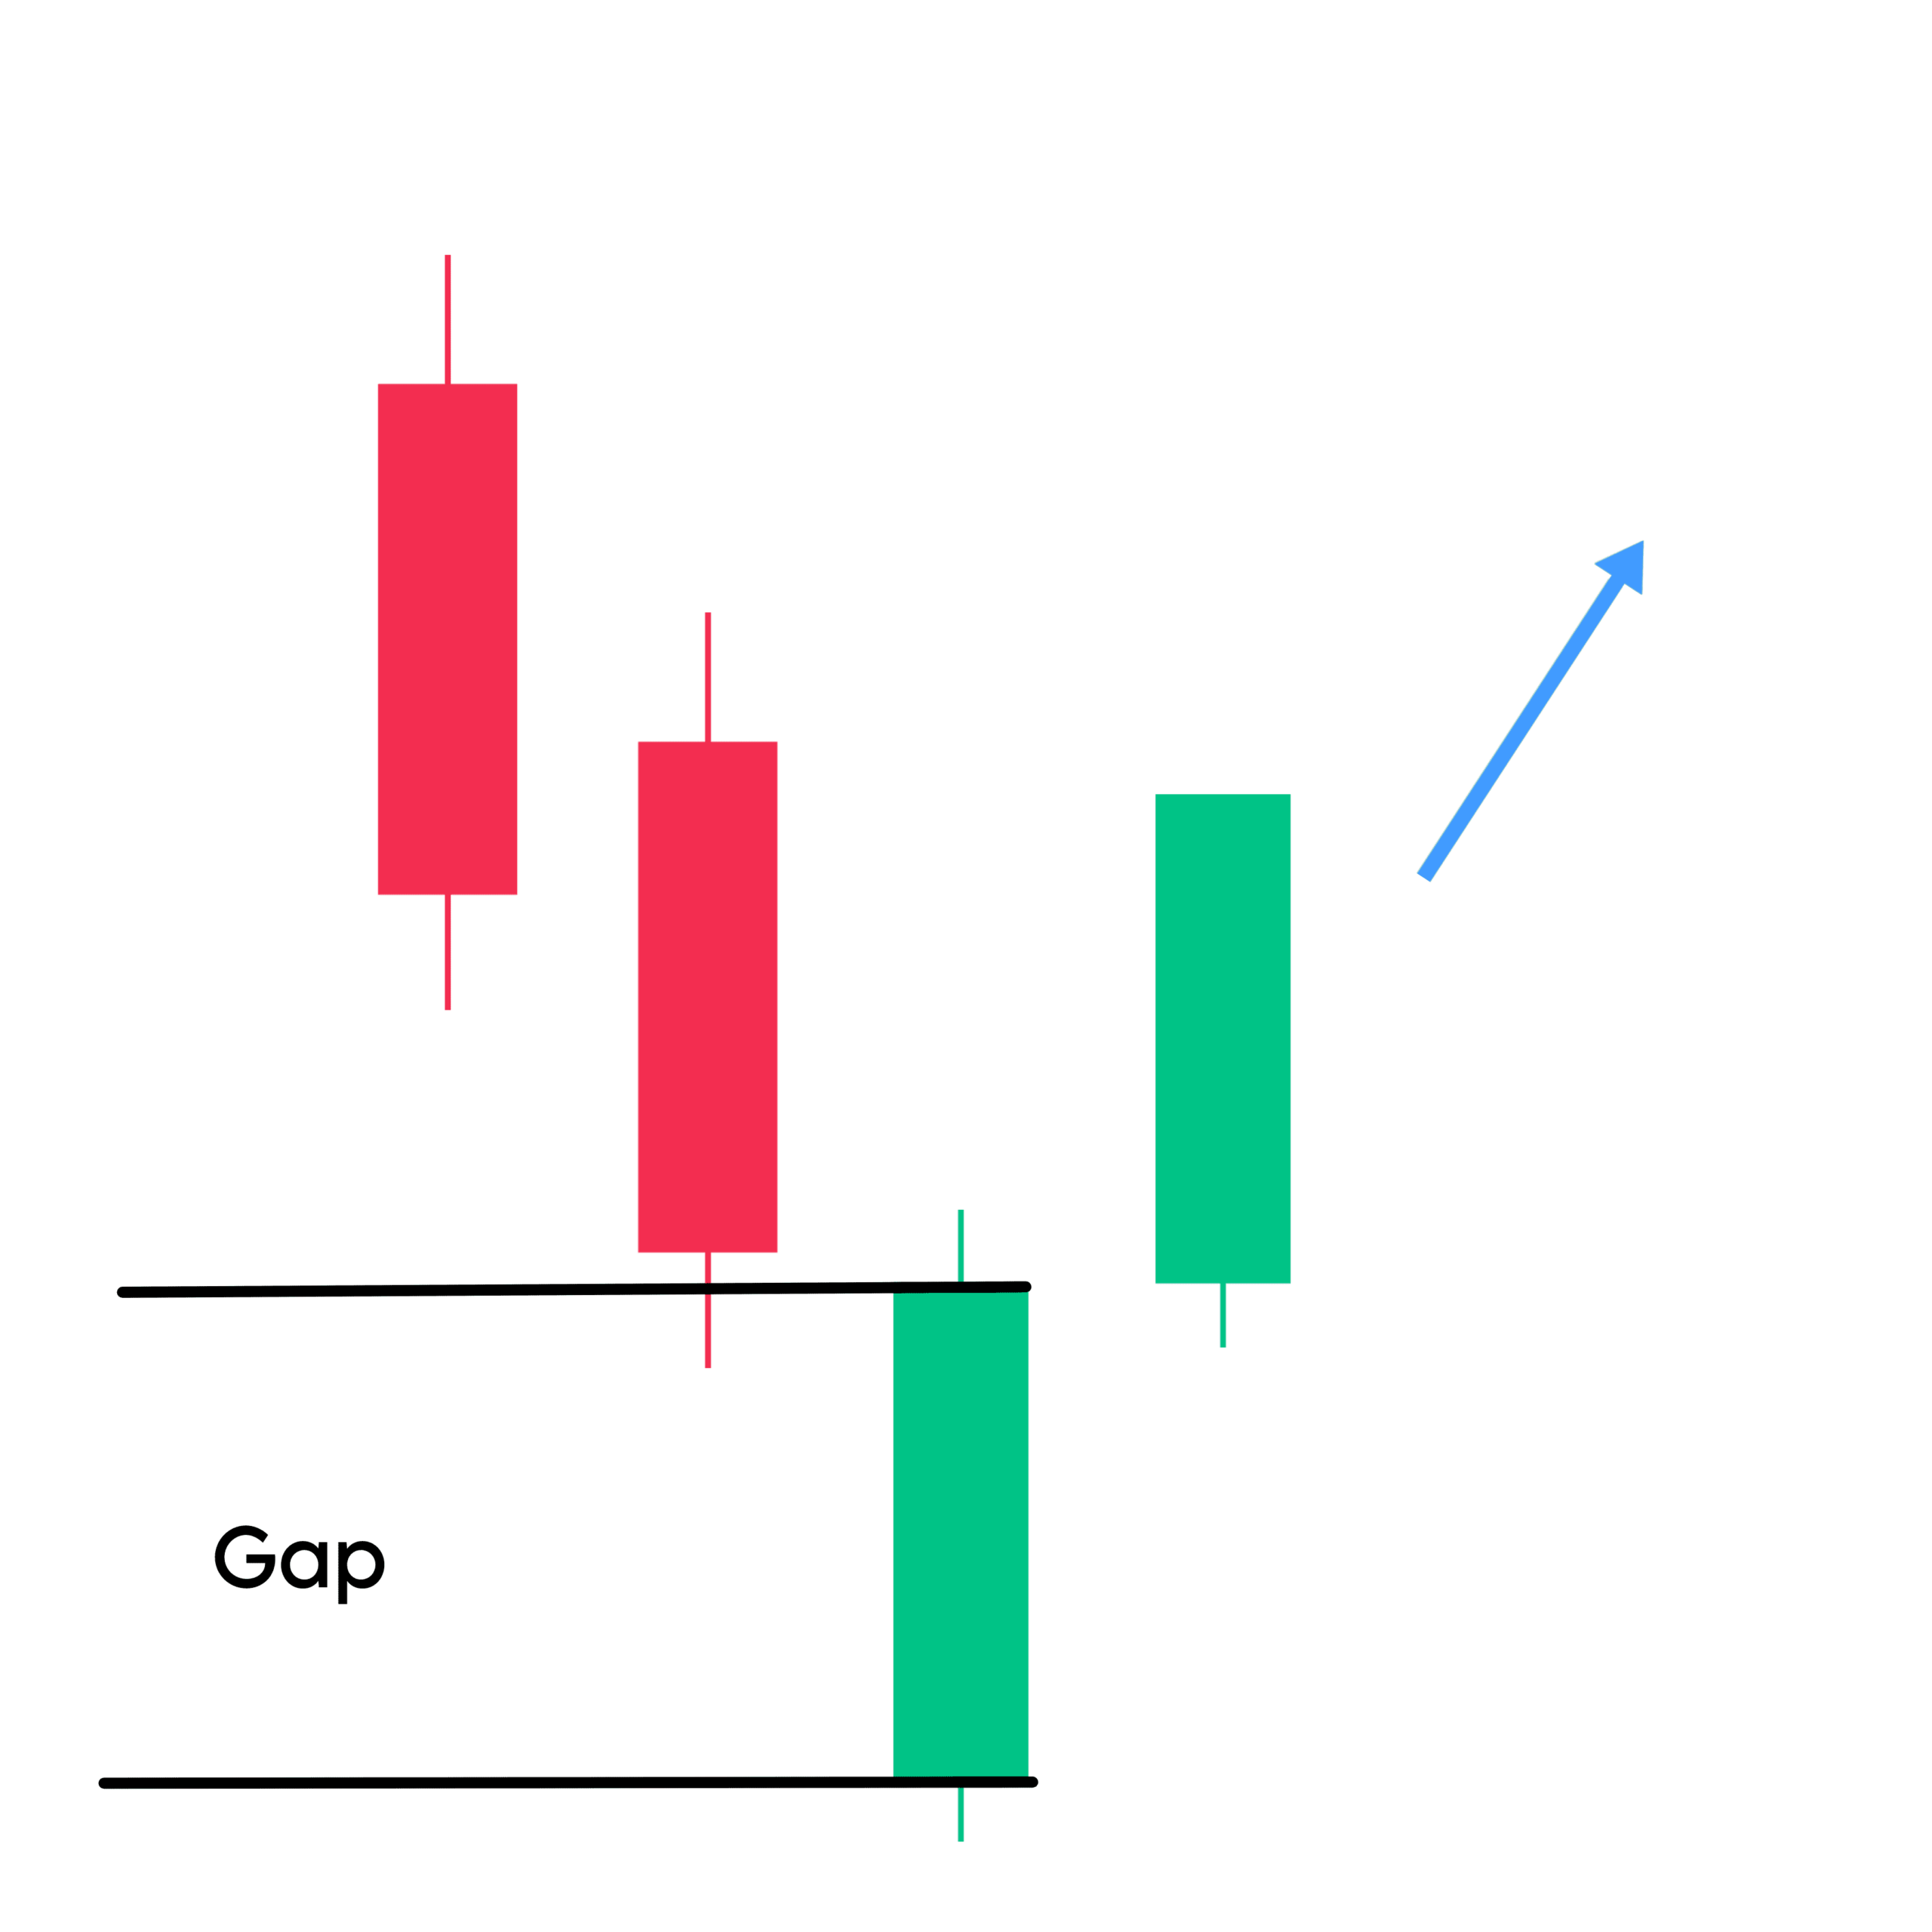
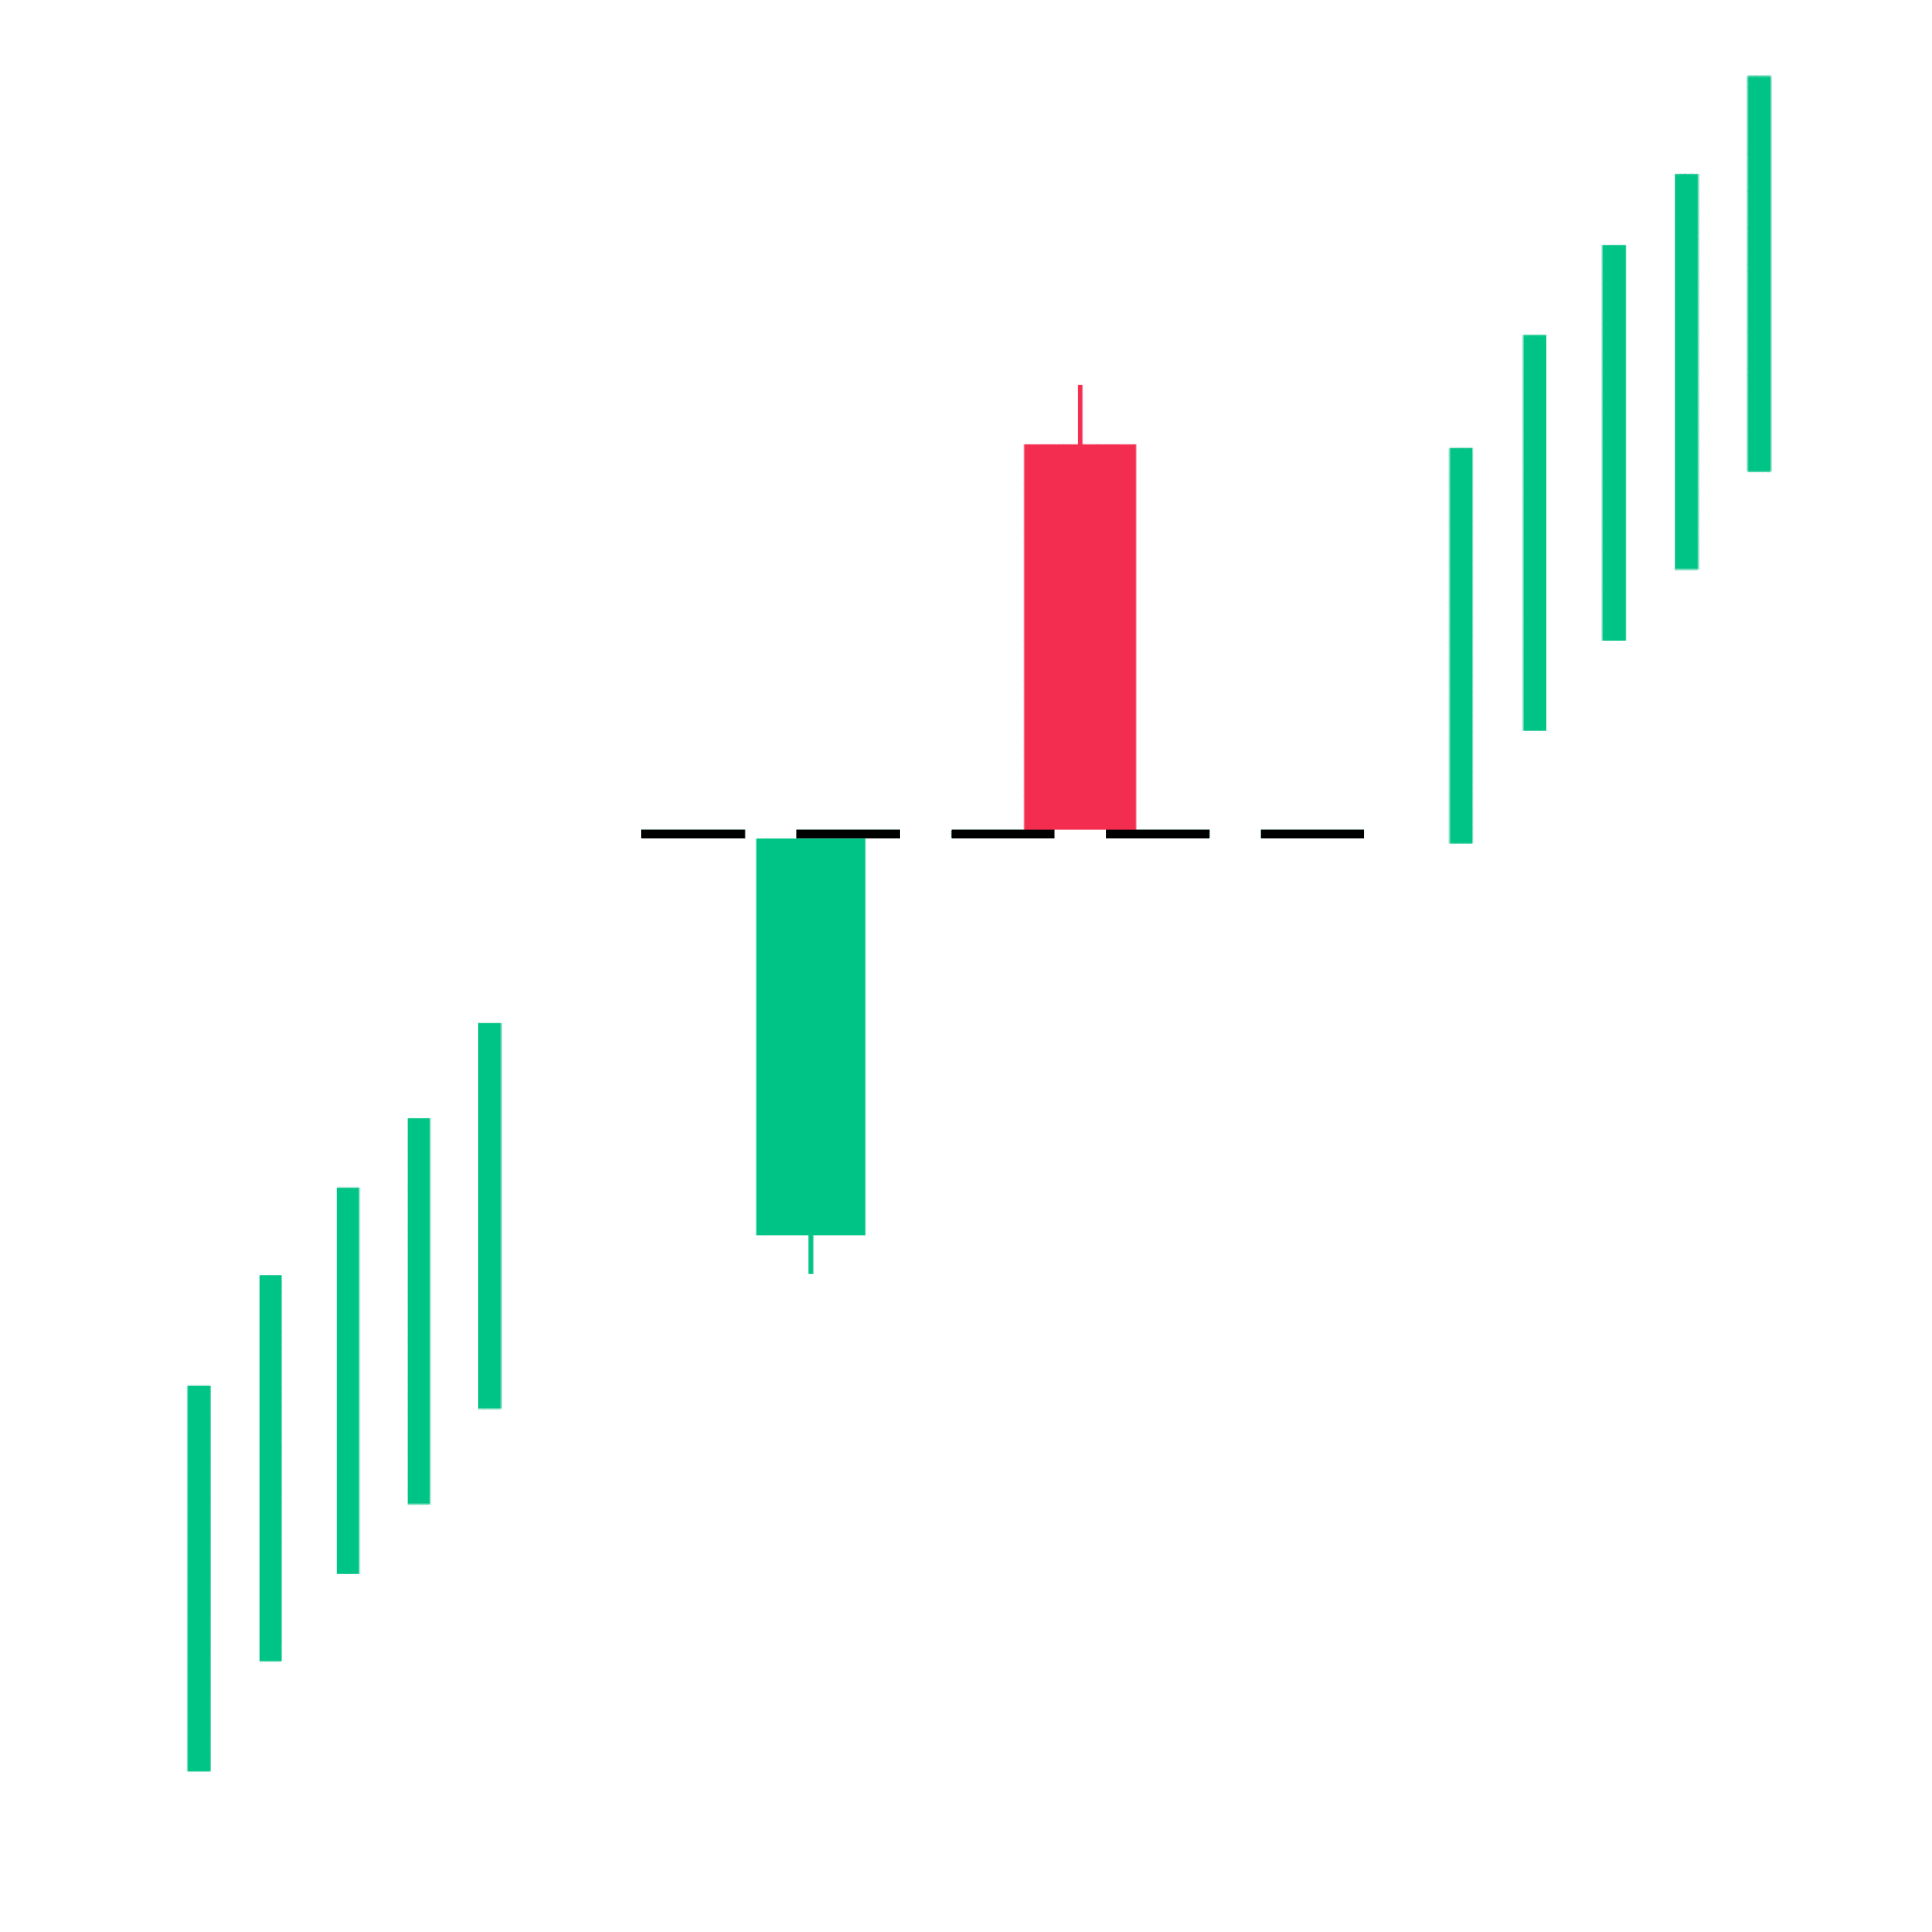
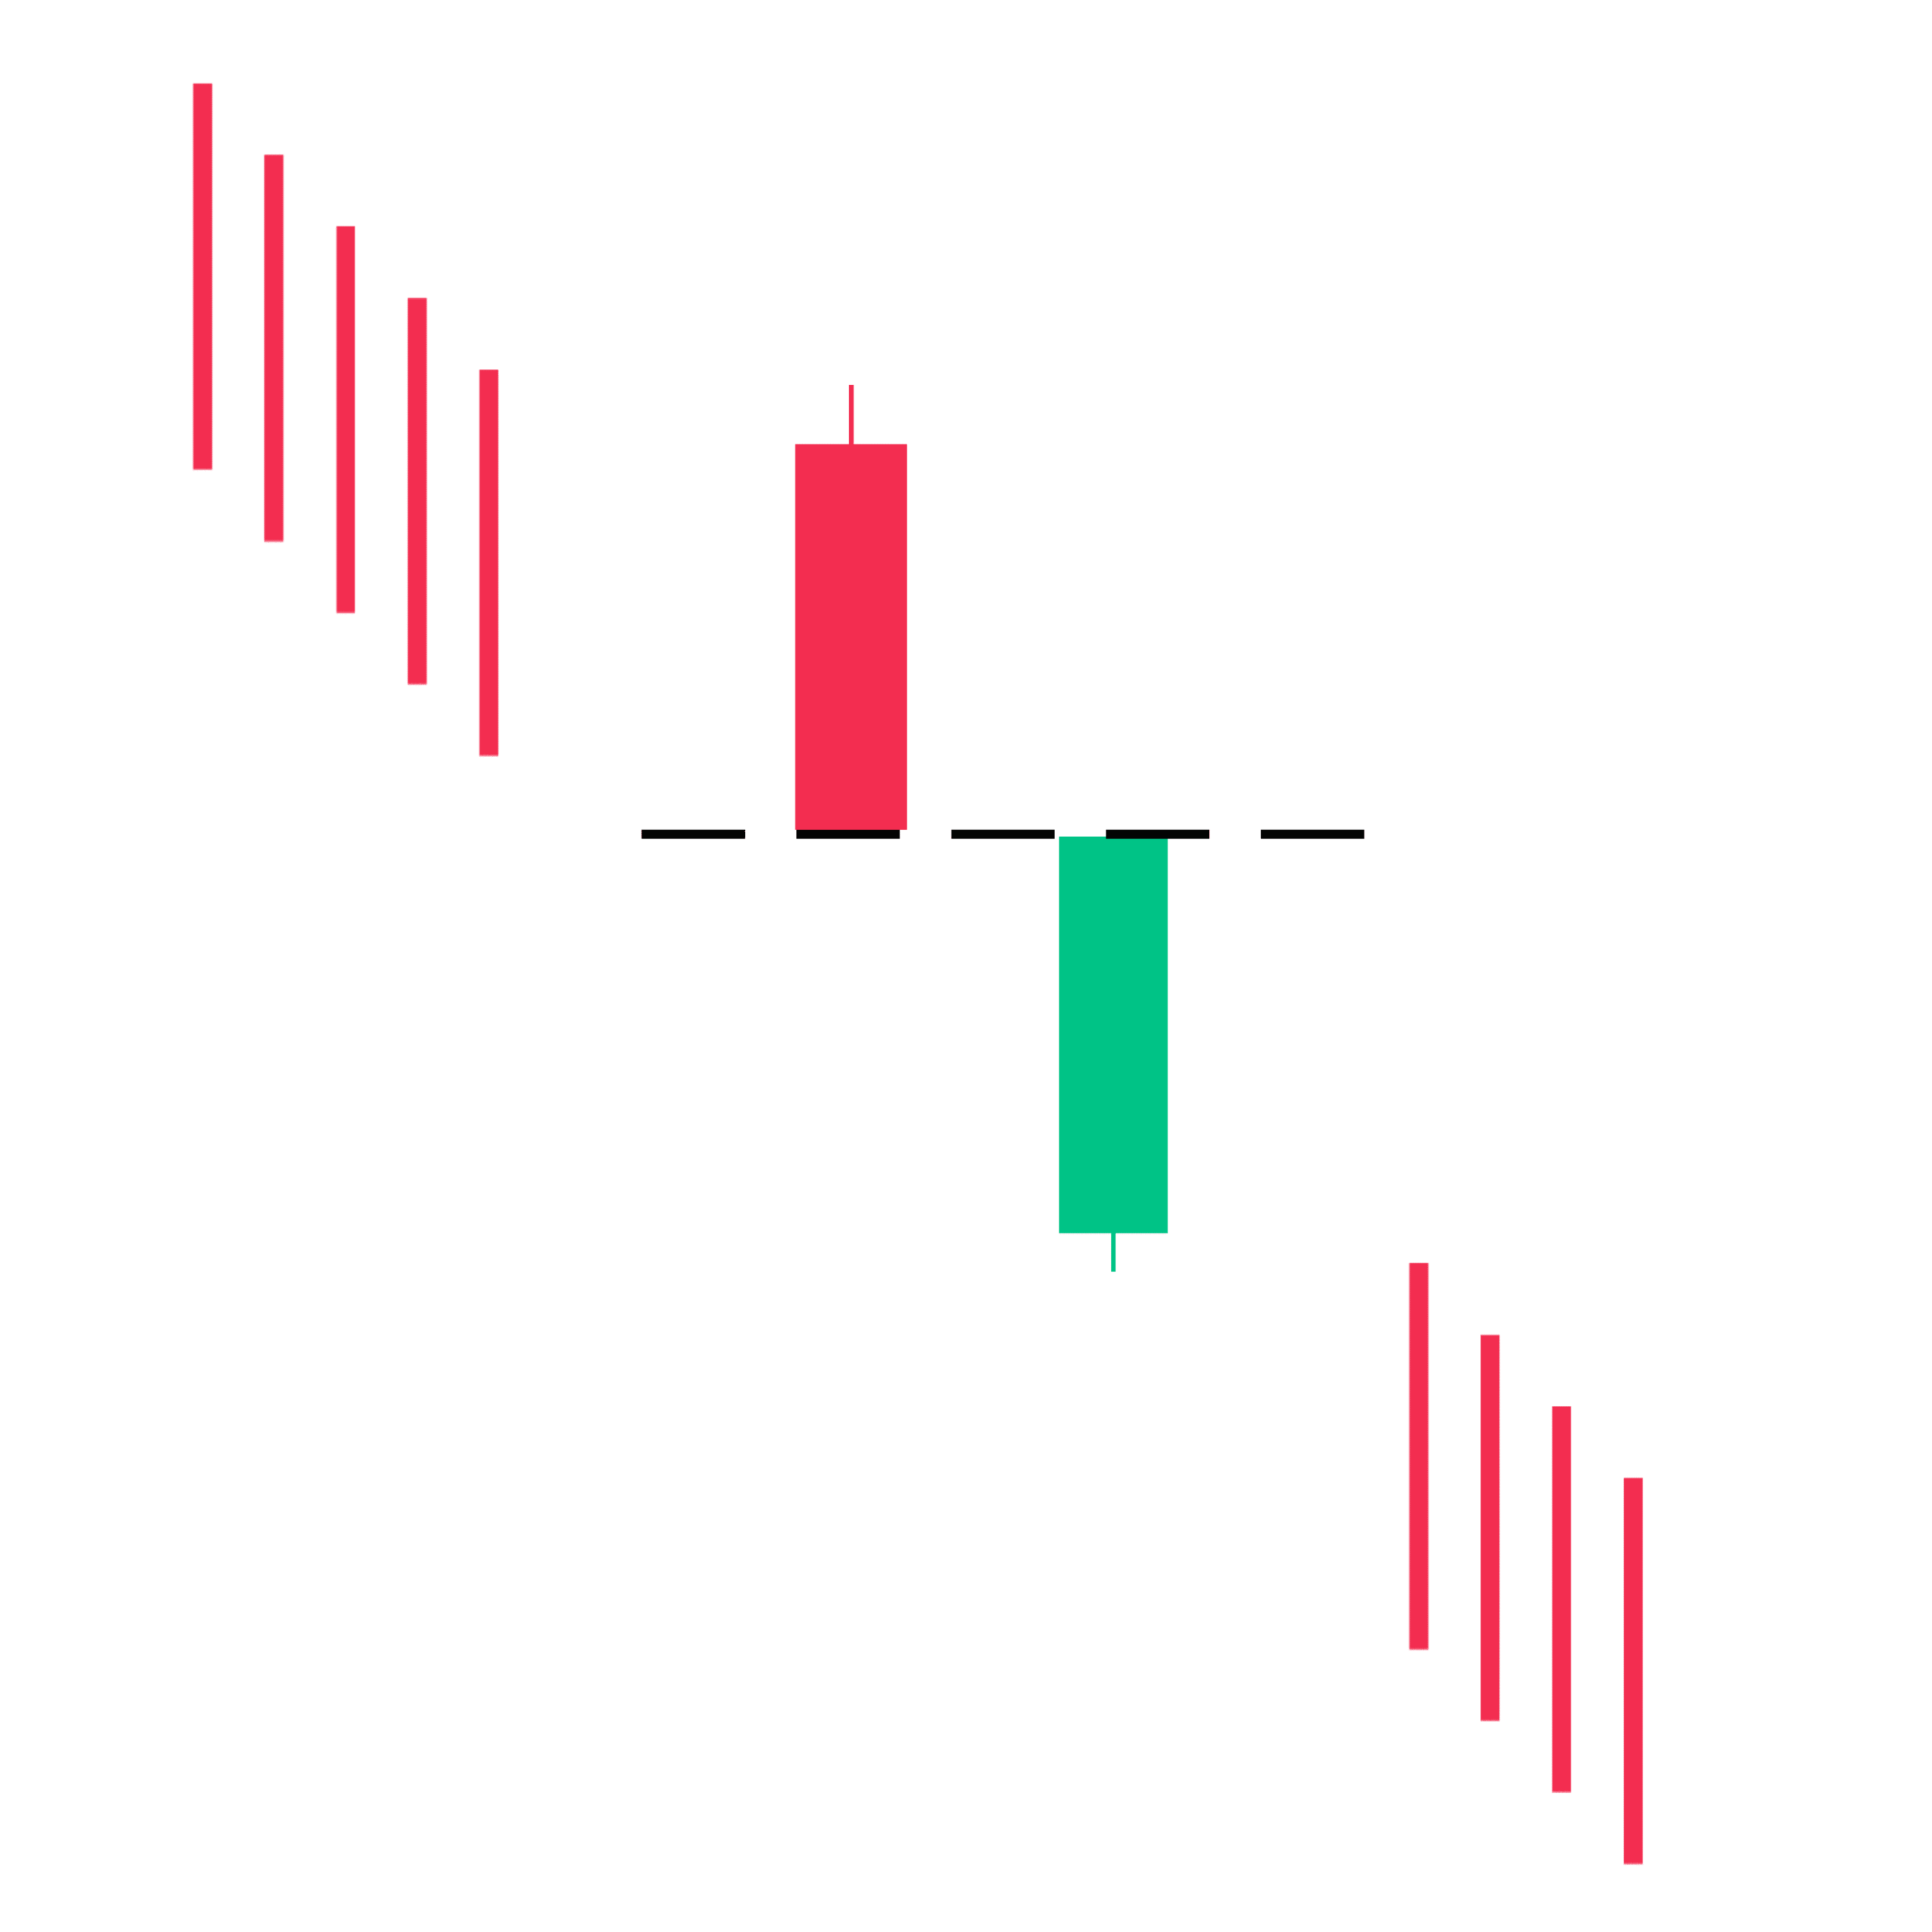
5 & 6. Rising & Falling Window
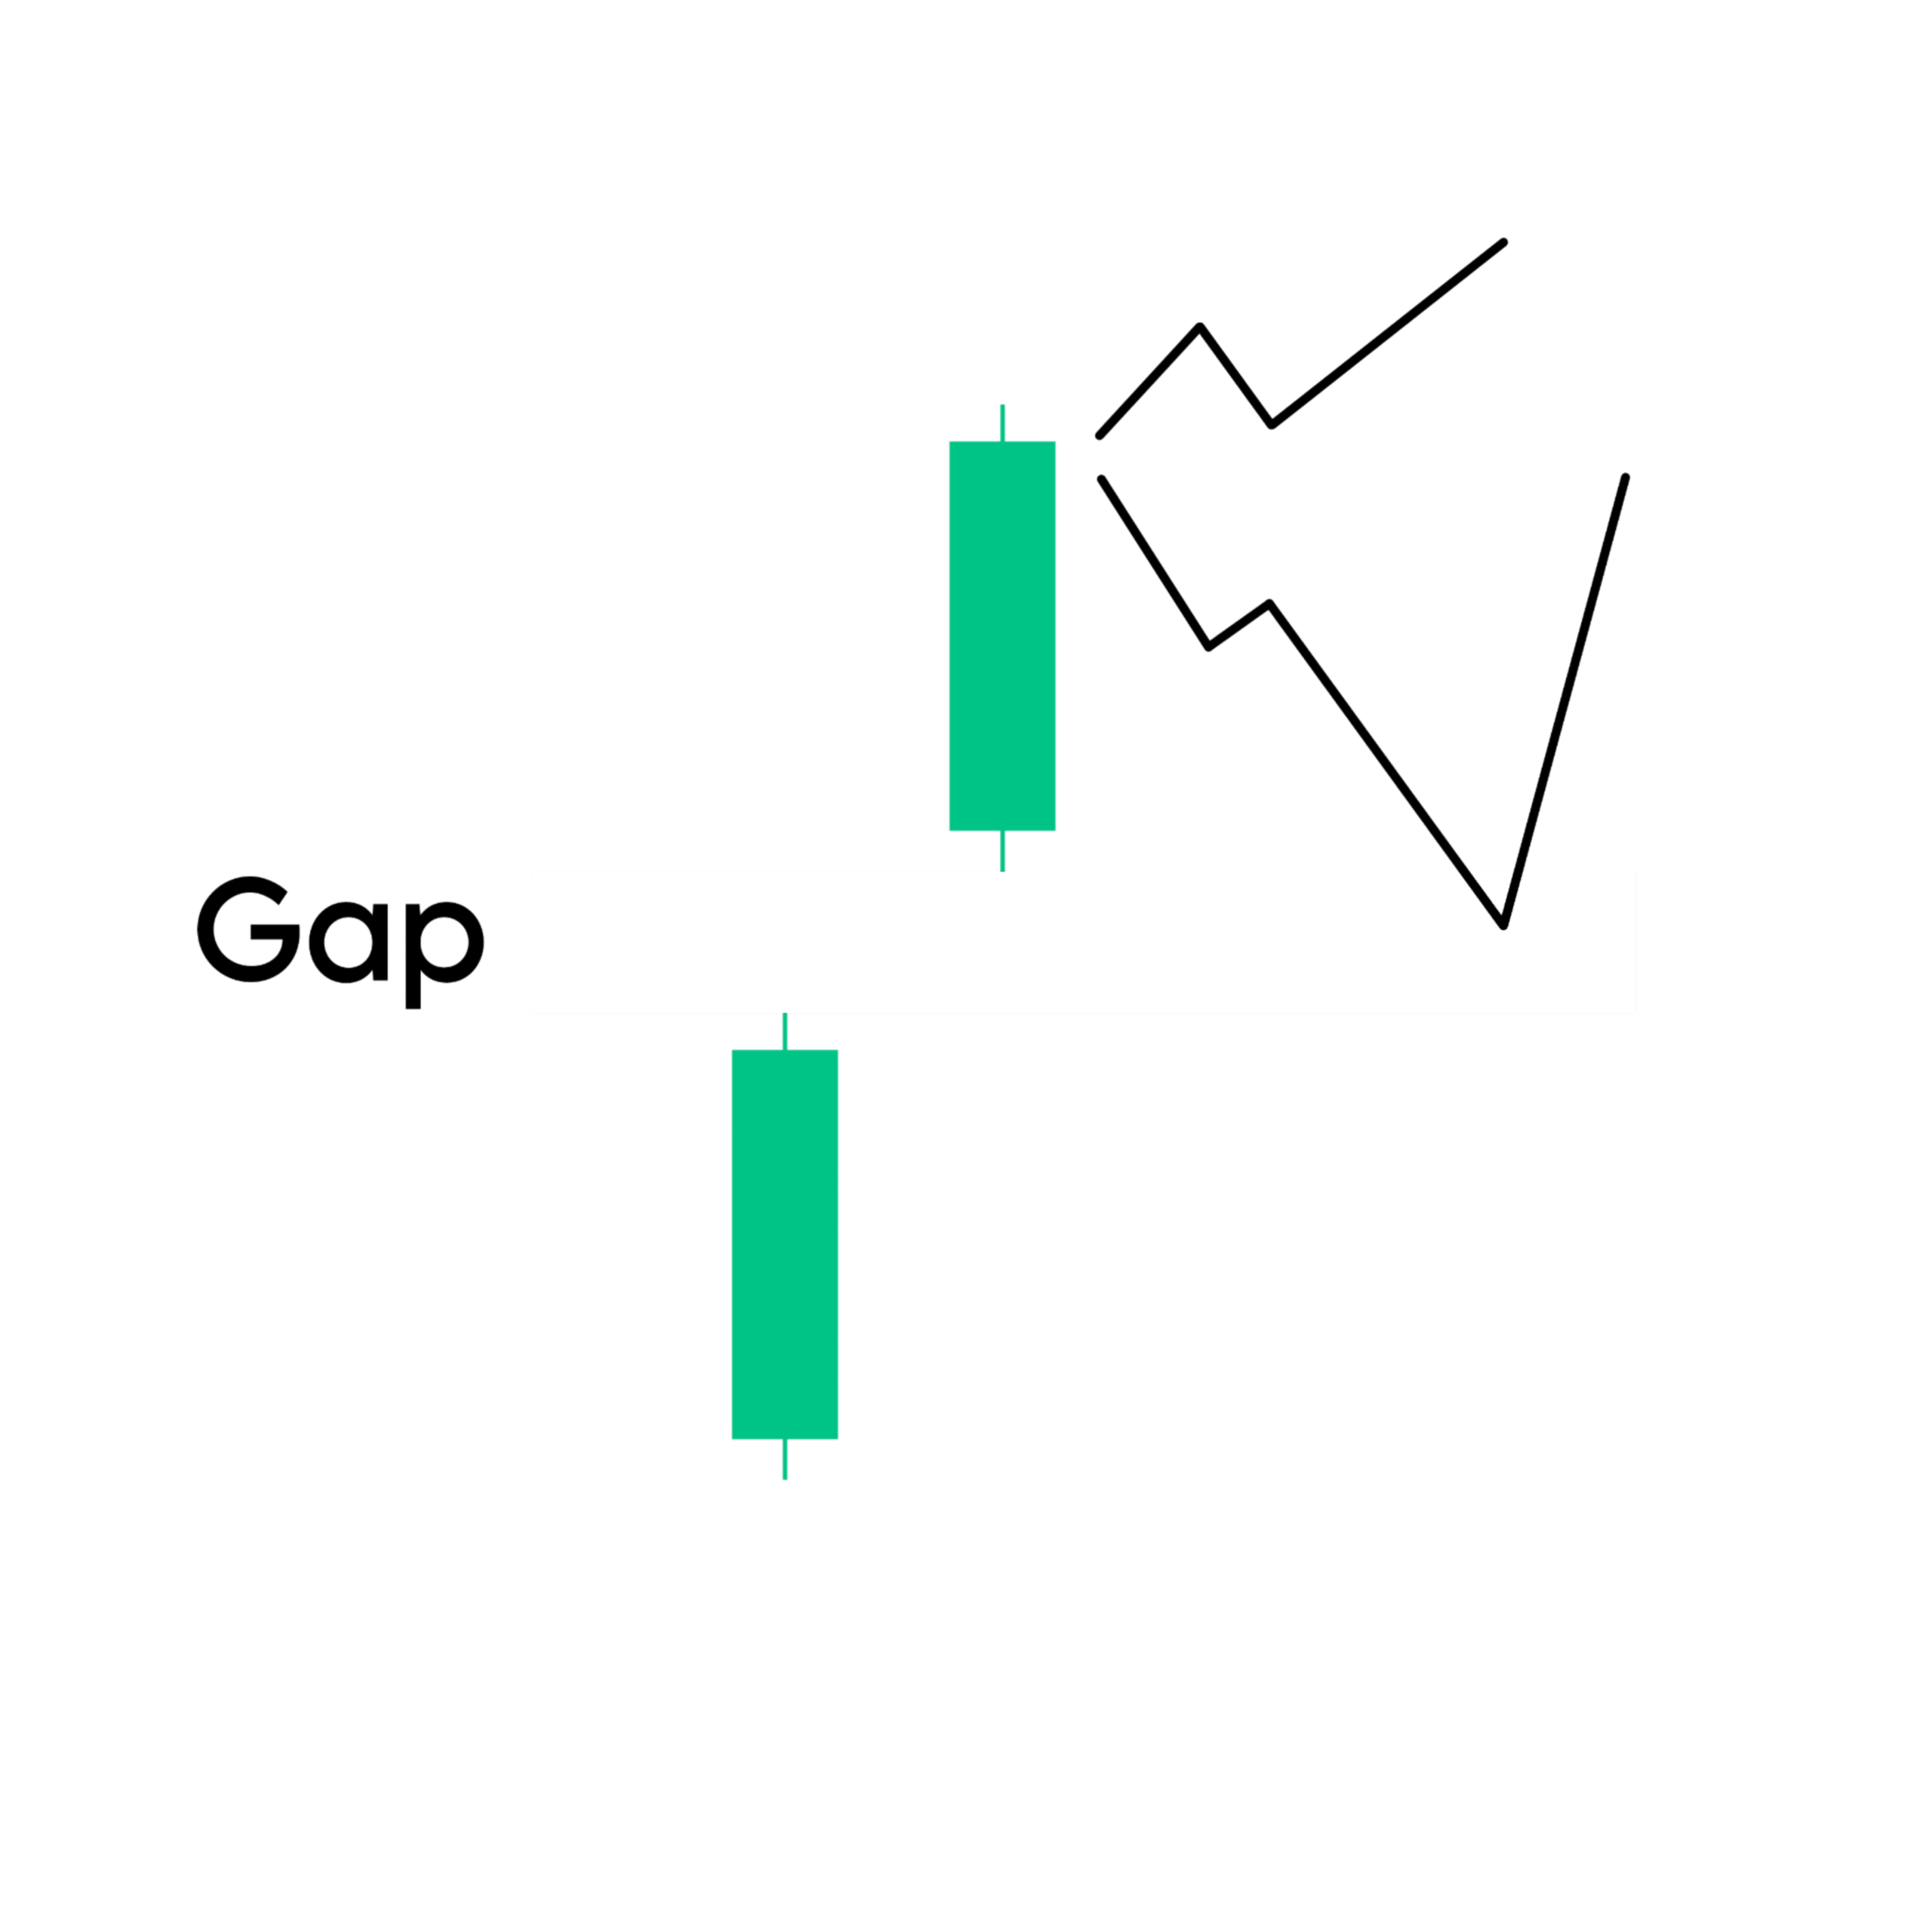
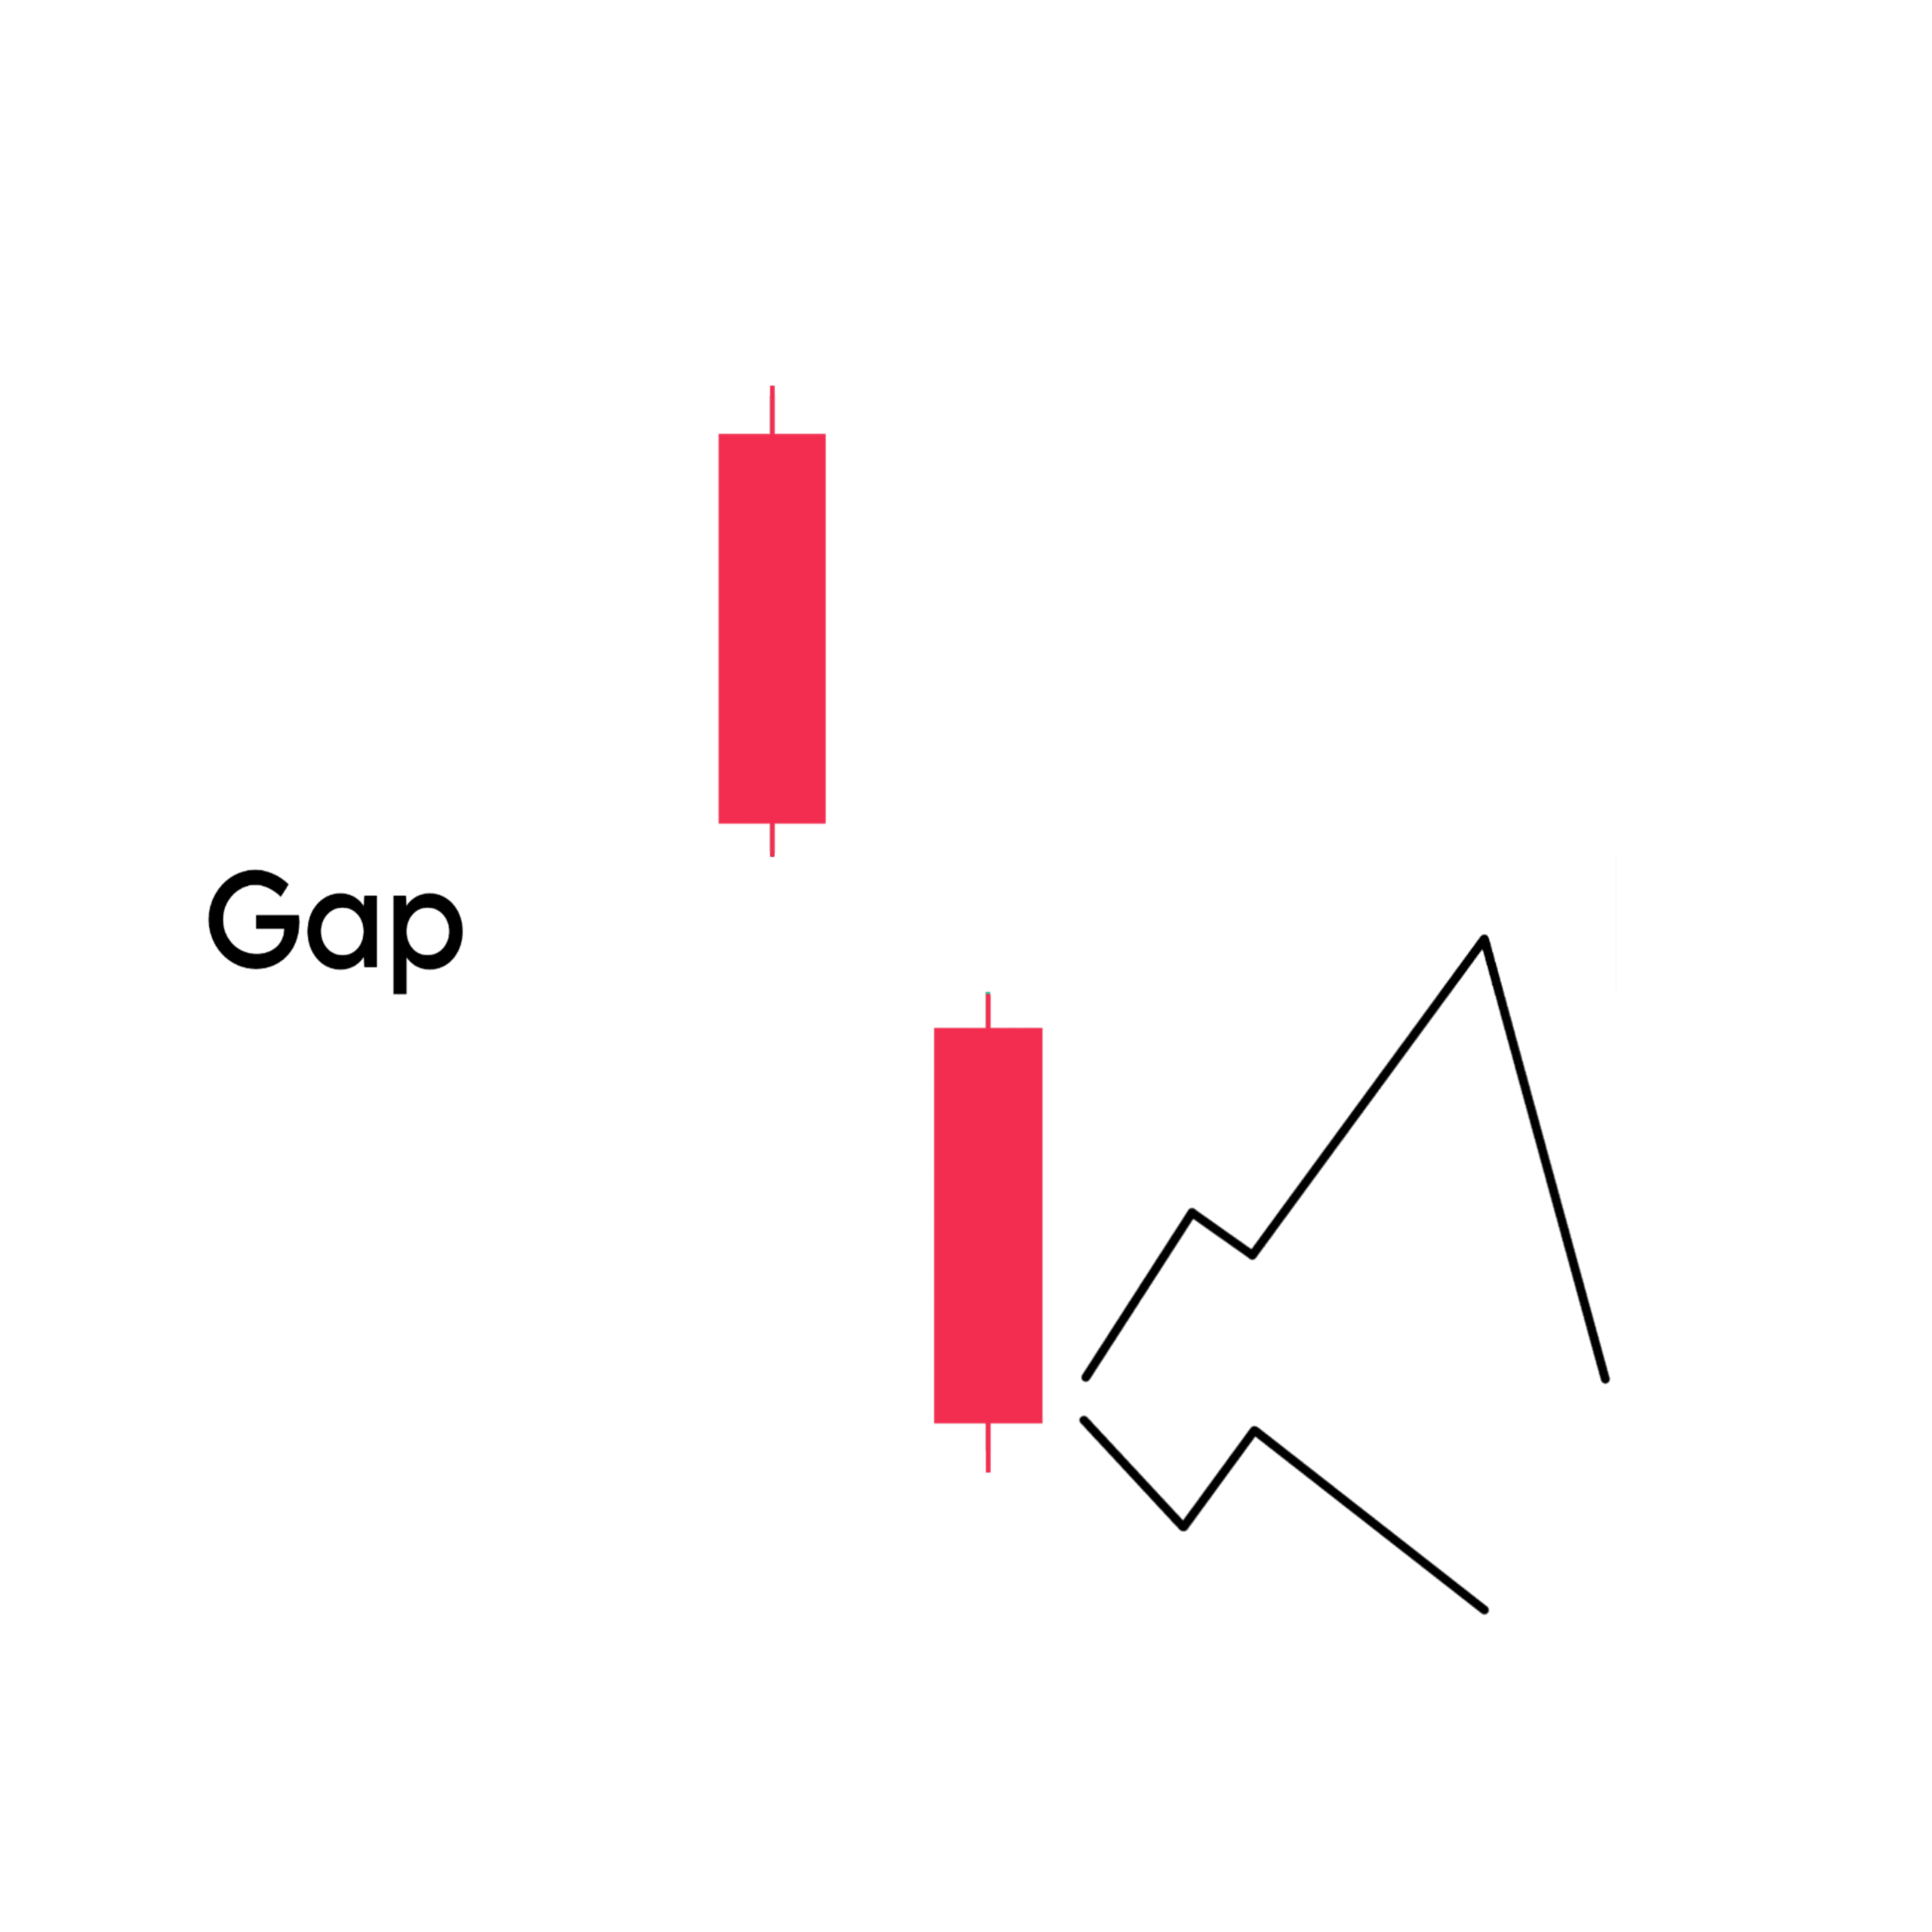
Rising Windows and Falling Windows, also known as “gaps” candlestick patterns that indicate a gap between the high and low of two consecutive candlesticks. Refer below Image for reference,
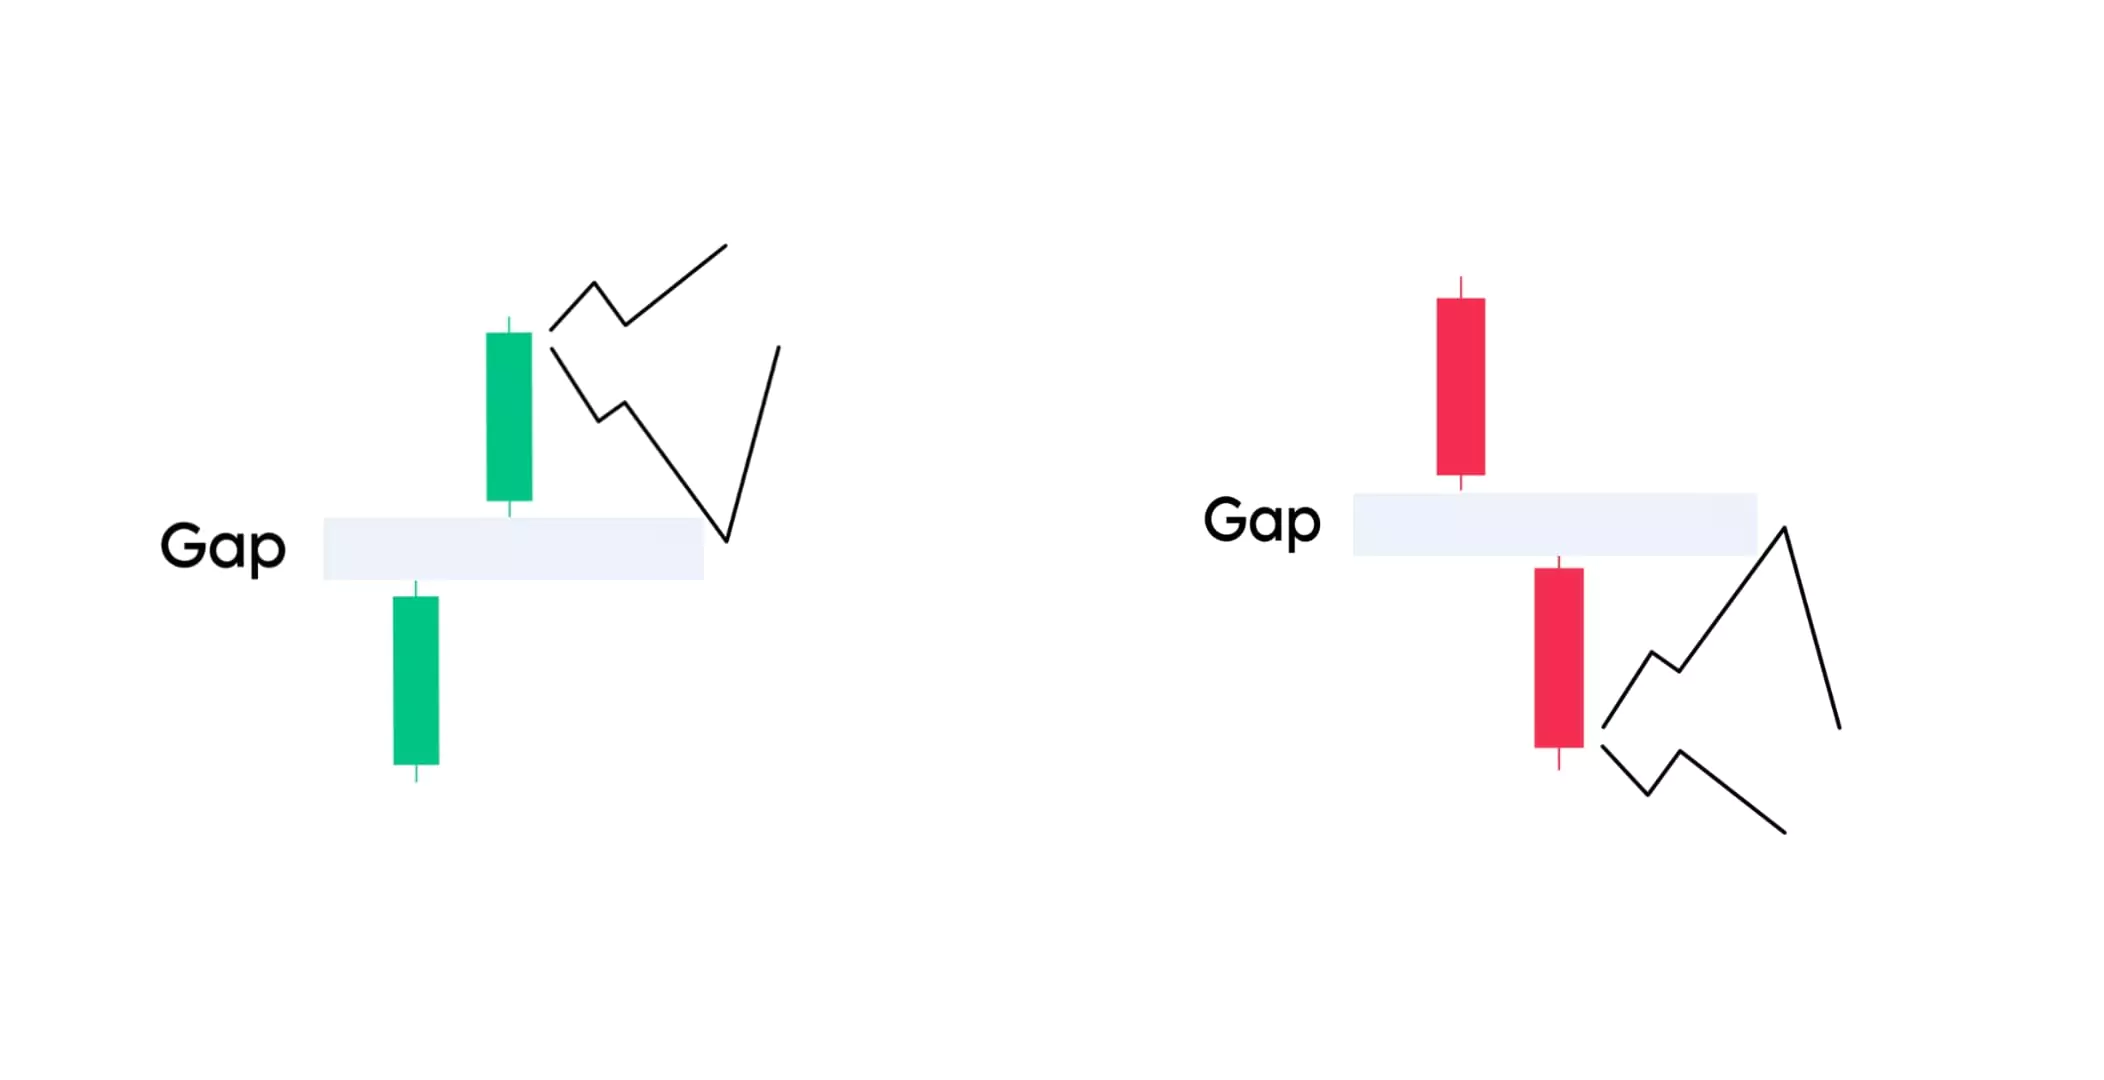
The rising window is a continuation candlestick pattern consisting of two bullish candlesticks with a gap between them. The second candle opens higher than the high of the first candle, creating a gap that occurs due to high trading volatility. It is an upward trend continuation candlestick pattern indicating strong strength of buyers in the market.
The falling window is a continuation candlestick pattern that consists of two bearish candlesticks with a gap between them. The second candle opens lower than the low of the first candle, creating a gap. it occurs due to high trading volatility. It is a trend continuation candlestick pattern, and it is an indication of the strong strength of sellers in the market.
The gap between the candles indicates a high buying or selling pressure, Both patterns usually appear during a trending market.
7 & 8. Bullish & Bearish Mat Hold

The Bullish Mat Hold and Bearish Mat Hold are continuation patterns that are considered as a variation of the Rising Three Methods and Falling Three Methods including minor differences respectively.
The Bullish Mat Hold suggests a temporary consolidation or pullback within an uptrend, followed by a strong continuation of the bullish momentum.
The Bearish Mat Hold suggests a temporary consolidation or short covering within a downtrend, followed by a strong continuation of the bearish momentum.
9 & 10. On Neck Bullish / Bearish
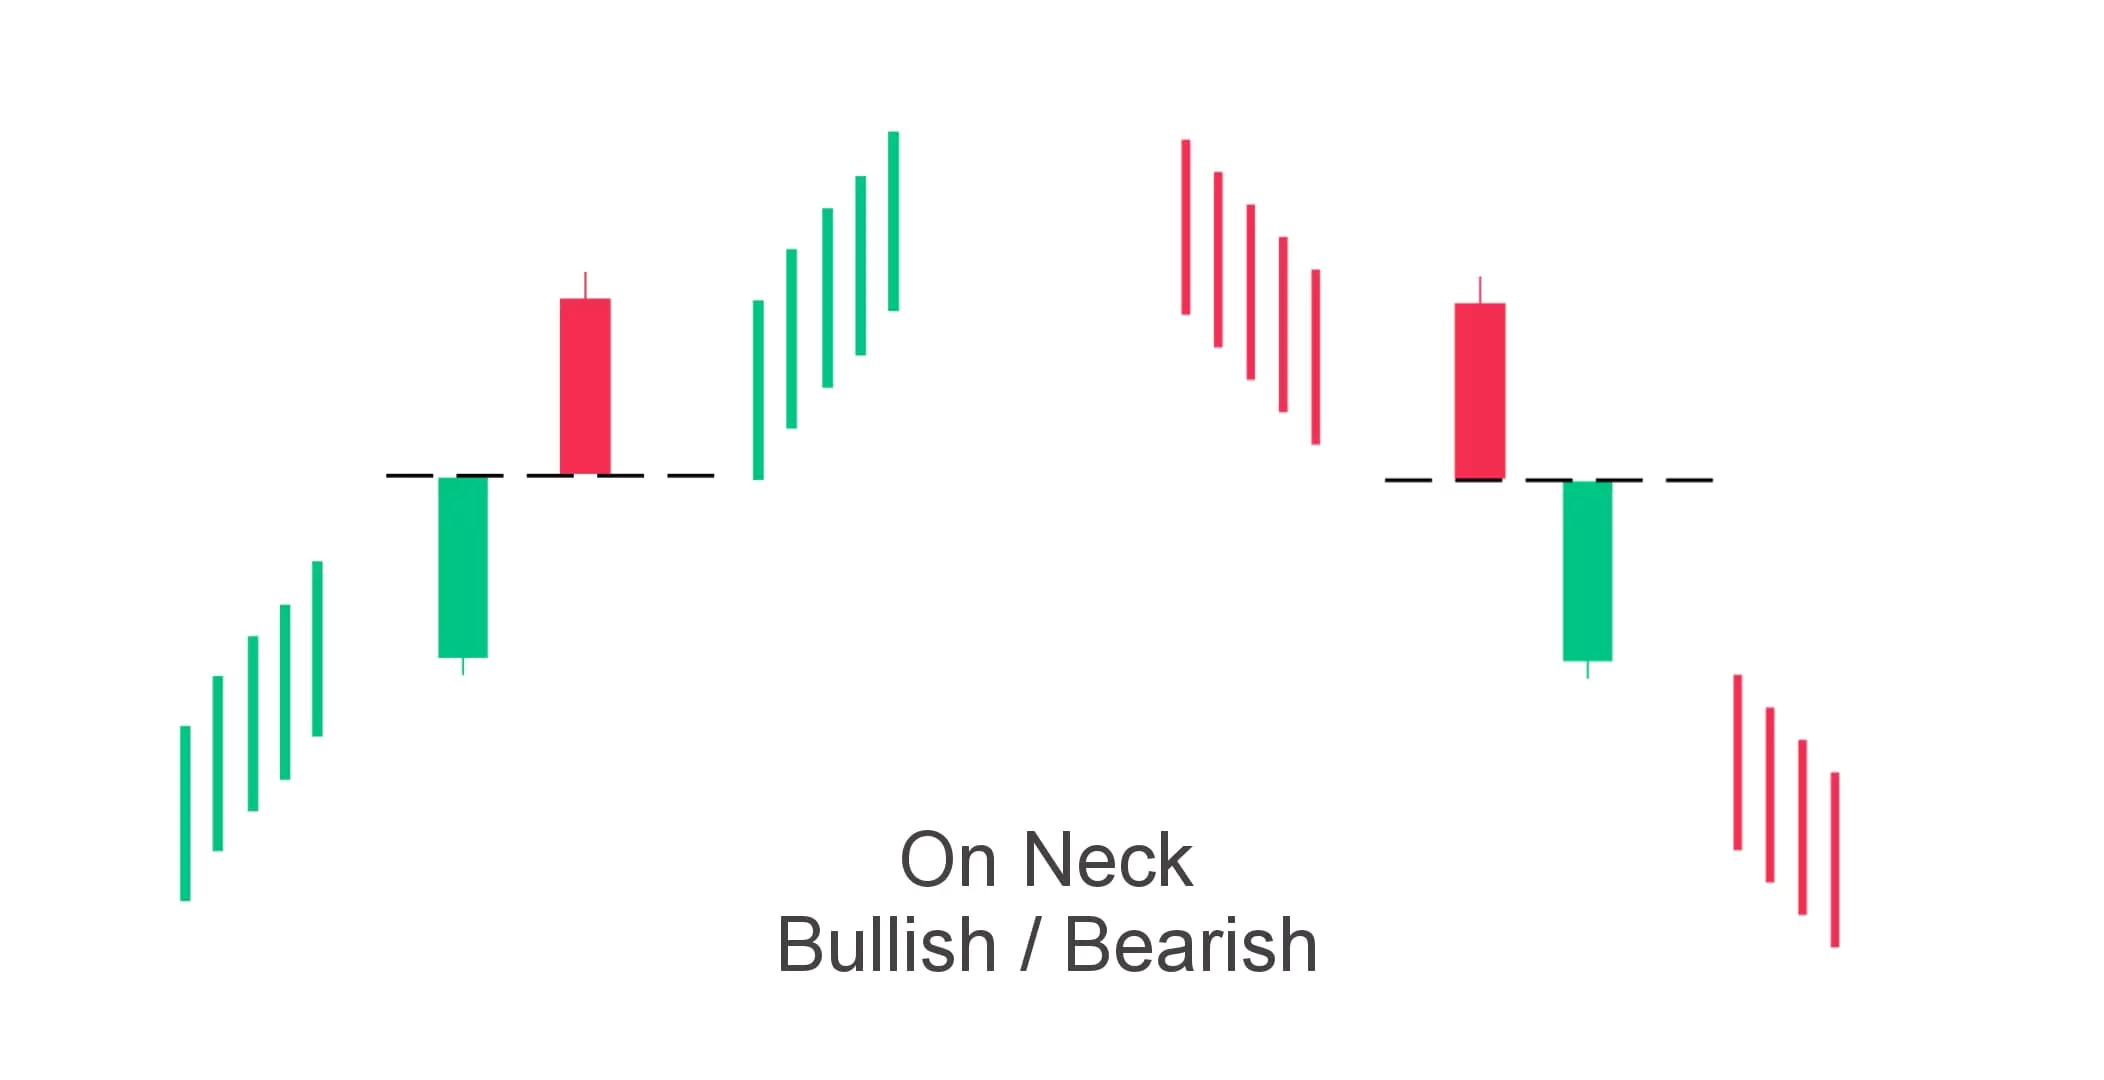
On Neck Bullish and On Neck Bearish patterns are typically considered as potential reversal patterns rather than continuation patterns. These patterns suggest a struggle between buyers and sellers at key levels, potentially indicating a reversal in the prevailing trend.
You can follow similar candlesticks, we do not have much information related to it. We will provide this information as soon as possible with real data.
11. Doji
A Doji candlestick is a neutral or indecision candlestick pattern that appears on price charts when the opening and closing prices are almost the same. This means there was a balance between buying and selling pressure, during the trading session.
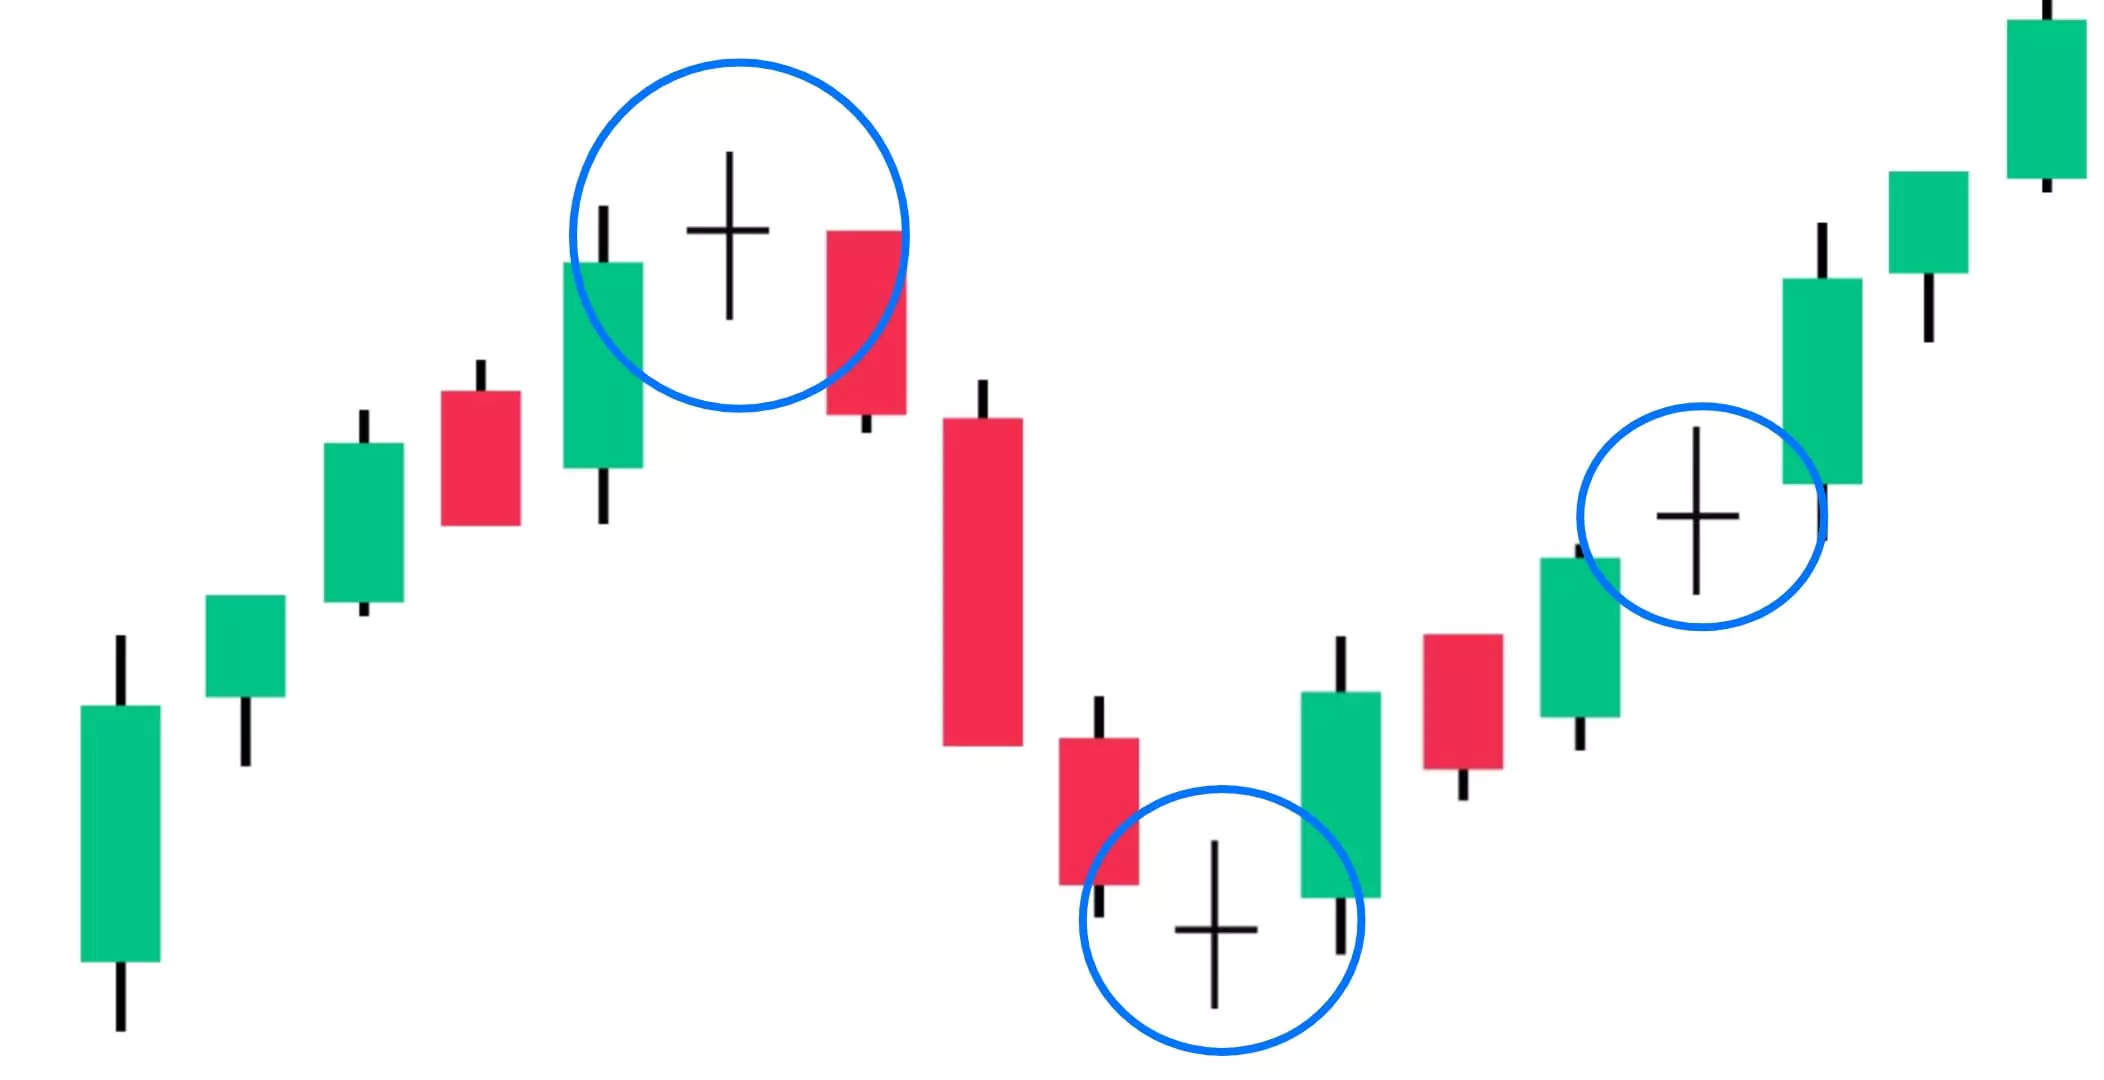
The word Doji comes from the Japanese phrase meaning “the same thing.” Dojis can appear in any market, but they are most commonly seen in trending markets as a sign of potential reversal as well as in continuation.
A Doji is formed when the opening price and the closing price of a candle are very close or near. As a result, the candle has a very small or non-existent body.
It represents a situation where buyers and sellers control the market, resulting in an open and close that is the same.
Traders look for confirmation from subsequent price action. For example, when a bullish/bearish candle breaks doji high/low following a Doji may confirm a reversal.
Doji pattern is a potential turning point in the market, indicating a possible reversal or continuation depending on its context.
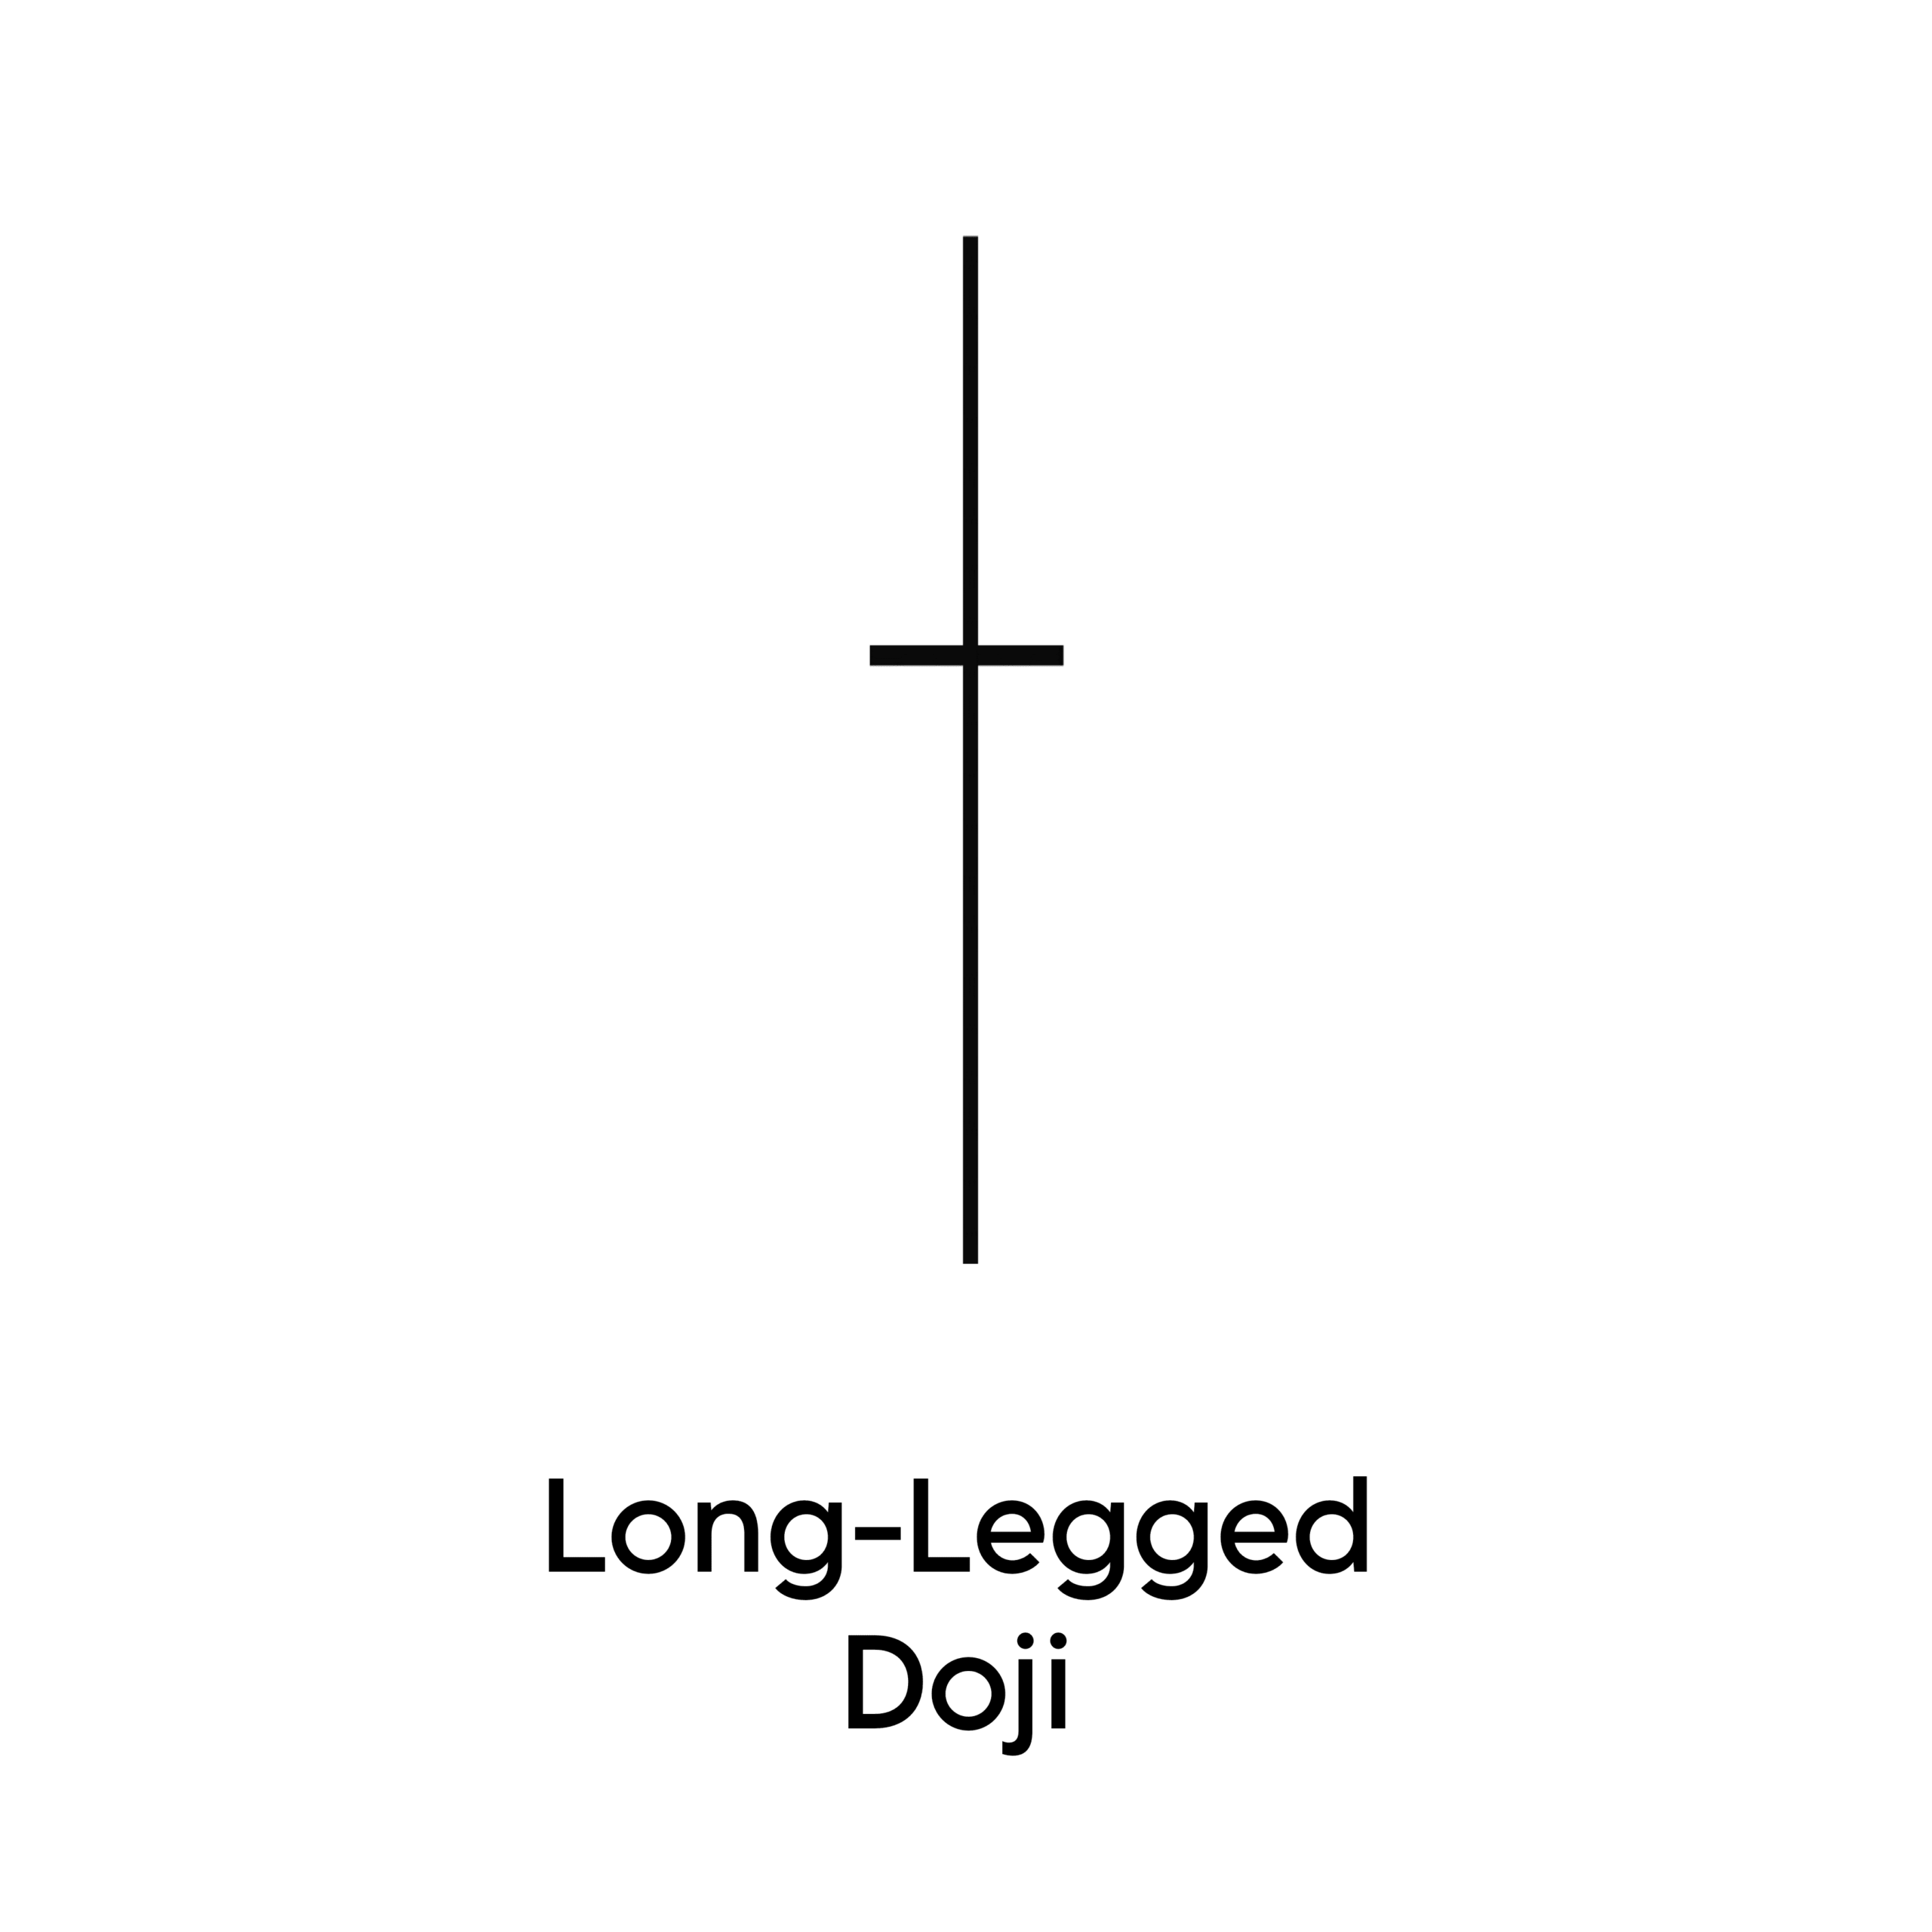
12. Long-Legged Doji
Long-legged doji is a single-candle pattern that includes long upper and lower shadows and a small or no real body. The pattern shows that there is an indecision between the buyers and the sellers and that the market is approaching a transition period.
The Long-Legged Doji signifies a state of uncertainty. The long upper and lower wicks indicate that both buyers and sellers had moments of control during the trading session but failed to establish dominance at the end of the trading session.
Candlestick Pattern Ebook (PDF Guide) Download
Welcome to our Candlestick Pattern Ebook: a comprehensive guide designed to illuminate the art of reading charts, deciphering trends, and unlocking the secrets of the candles on the trading canvas. Whether you’re a beginner or a pro this ebook helps the world of technical analysis, this guide is your roadmap to unraveling the stories told by these flickering flames of financial data charts. Candlestick patterns open the door to understanding the language of the markets so let’s learn with candlestick presentation..
The Bottom Line
These 40+ patterns help traders analyze market sentiment and make predictions about future price movements. Different patterns suggest various trends or reversals, providing insights.
Whenever you talk about learning something in the market, remember these three points – Practice Makes Perfect, Integration with Risk Management, and Learn from Mistakes.
Remember, Trading carries inherent risks, and it’s important to trade responsibly and never risk more capital than you can afford to lose. Some people lose their capital without a proper plan execution and psychological issues, and they don’t handle their risk management in crucial situations so first learn then earn.
Leave a comment and share your thoughts with Trade Mint. Your feedback is most valuable!
Thank you for reading this complete article!
Happy Learning! Happy Trading!

UPSTOX
Invest Right, Invest Now with UPSTOX
Open Account

ZERODHA
Invest in Everything with ZERODHA
Open Account

FYERS
Trading Simplified FYERS
Open Account

KOTAK NEO
New Age of Investing Kotak
Open Account

Frequently Asked Questions (FAQs)
What are candlestick patterns?
Candlestick patterns are a visual or graphical representation of price movements in financial markets. They consist of one or more candlesticks that illustrate the open, close, high, and low prices for a specific time period. Traders use these patterns to analyze and predict market trends and future possibilities of the price direction.
How do candlestick patterns help traders?
Candlestick patterns are a part of technical analysis to help traders identify potential trend reversals and continuation patterns. When creating these formations, traders can make informed decisions about when to buy, sell, or hold a trade and Investments.
What are some common candlestick patterns?
Common patterns include Doji, Hammer, Shooting Star, Engulfing patterns, and Morning/Evening Star formations. Each pattern formation has its own unique significance like bullish, bearish, and continuation sentiments provide insights into the market.
What is the difference between bullish and bearish candlestick patterns?
Bullish patterns suggest a potential upward price movement, while bearish patterns indicate a potential downward movement. Traders use these patterns to gauge market sentiment and make decisions accordingly.
What are the basics of technical analysis?
Technical analysis involves Trend analysis, Chart pattern/Candlestick pattern, Technical indicators, Support and Resistance, and Trendline these are the basic points of technical analysis.
Do candlestick patterns work?
Yes and no, both are unanswerable because trading is a game of prediction when we use candlesticks sometimes we are correct, but note that candlestick patterns give only possibilities for traders. Some of the patterns work pretty well, and some of them can be improved by adding strategies. Most traders believe that candlestick patterns work because they see a pattern and they find accuracy percentages. So candlestick pattern suggests what we do and the possibilities of pattern.
Do traders use candlestick patterns in their trading strategies?
Absolutely! Traders integrate candlestick patterns into their trading strategies in multiple ways Candlestick patterns are like the language of the market for traders. They provide valuable information about price movements and market sentiment. Traders use these patterns to make informed decisions about when to buy or sell using their own strategies for best results. Each candlestick has specific and unique conditions like open, high, low, and close prices for a specific time period It’s like decoding the market’s secrets!
Which are the best Candlestick Patterns for day trading?
Some of the commonly used patterns in day trading are: Hammer, Shooting Star, Evening and Morning Star, Bullish and bearish engulfing patterns, and Pinbar These are the most commonly used patterns by traders in day trading.
What is the success rate of candlesticks?
The average success rate of some of the most accurate candlestick patterns comes out to at most, about 50-70% when used alone.
Disclaimer: All investments in financial markets involve risk, and the past performance of a market, industry, sector, securities, trading strategy, or individual’s trading does not guarantee future results. Investors and traders are fully responsible for any investment or trading decisions they make. This post is for educational purposes only and does not constitute investment advice.
Article Source: Wikipedia – Candlestick Pattern,








Good information
Thanks.. Let’s move forward together
Xclent
Superb sir very nice .In very simple language i understood thanku so much love u sir,,,,